Note
Access to this page requires authorization. You can try signing in or changing directories.
Access to this page requires authorization. You can try changing directories.
Note
Authoring of AI instructions and AI data schema is available only in Power BI Desktop, and for Verified answers it's available in both Power BI Desktop and the Power BI service. Consumption of these features is available everywhere Copilot exists.
In this tutorial, you explore your data using an AI assistant. You learn to:
- Understand the data
- Dig deeper
- Write a summary
Note
Copilot outputs are nondeterministic; meaning that it's possible that a user receives a different output from a Copilot experience, despite using the same prompt and grounding data. It's important to set expectations with users so that they know what kinds of outputs to expect from Copilot, and how they can evaluate or validate these outputs, for themselves.
Learn more about the Responsible use of Copilot in Power BI.
Copilot
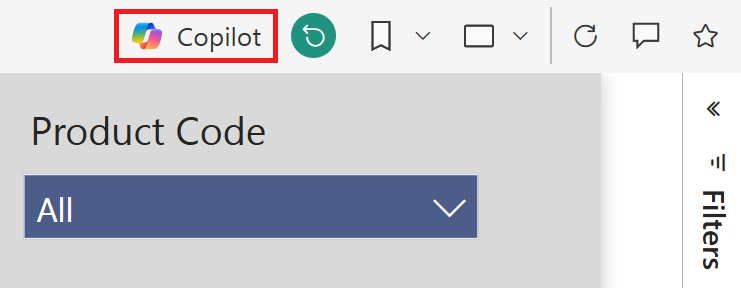
From the action bar, select the Copilot button on the right-hand side.
Understand the data
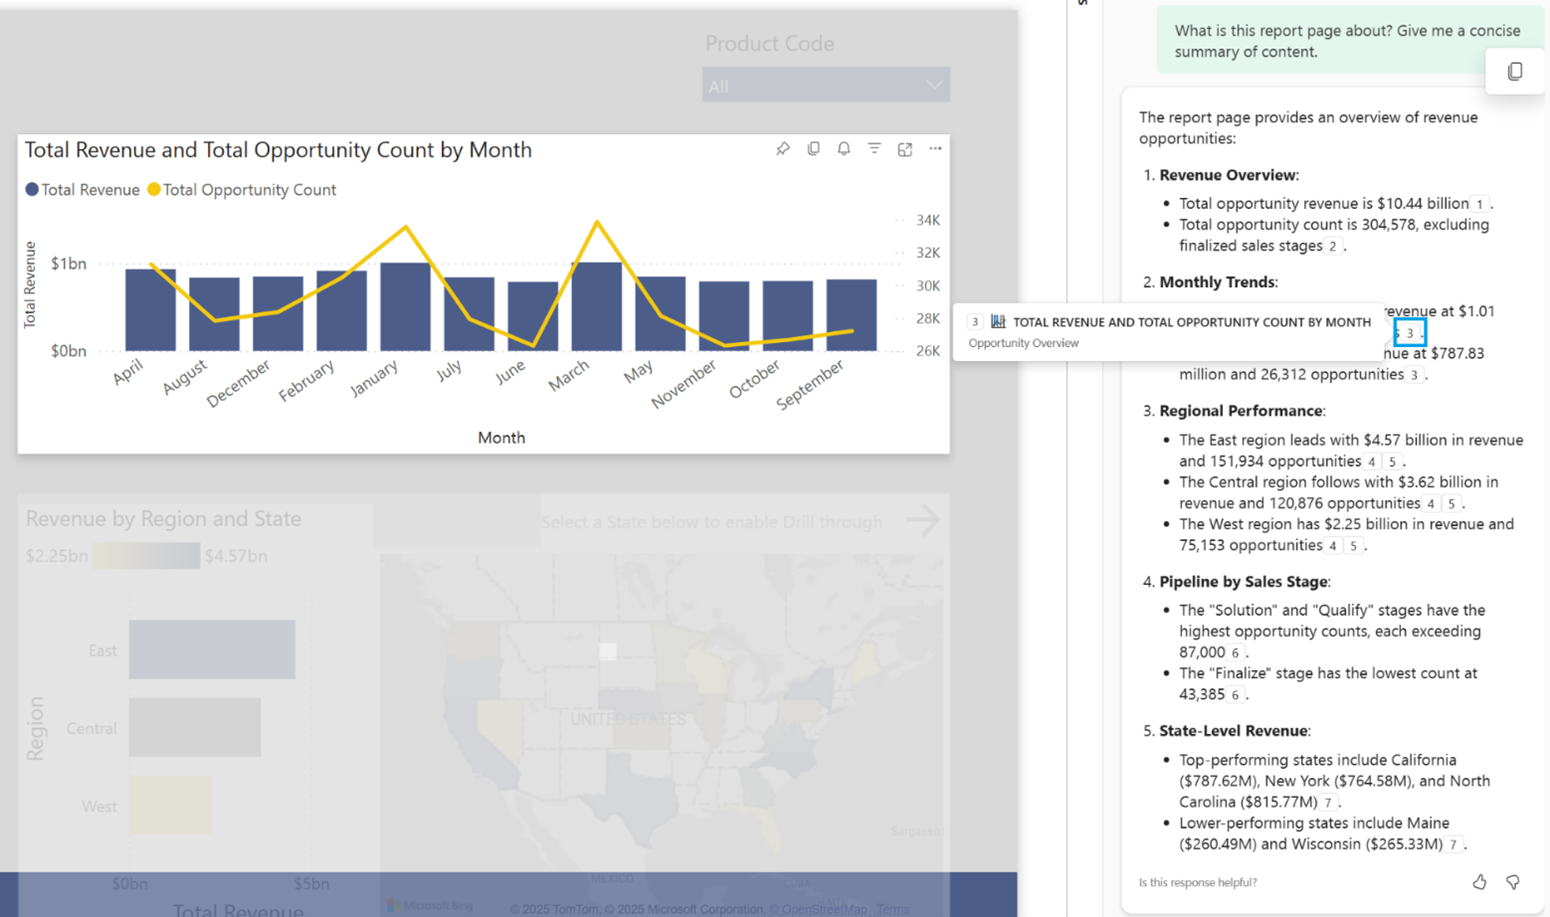
From the Copilot pane, expand the Understand the data group and select the What is this report page about? prompt.
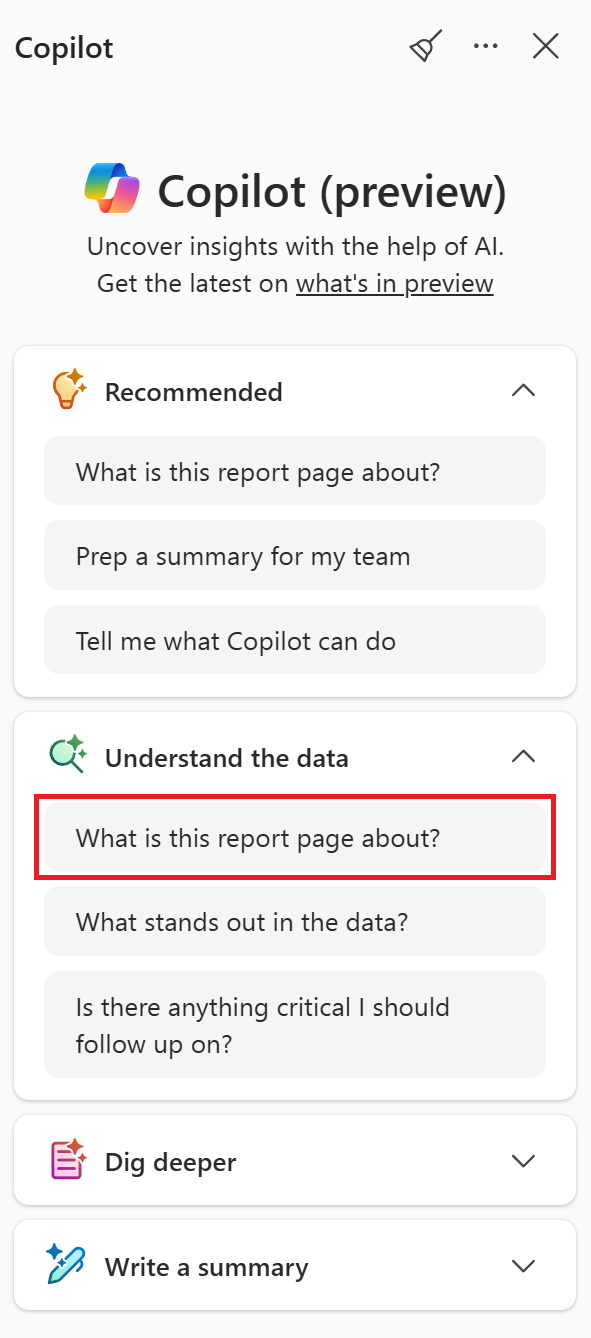
A report summary is created, including reference footnotes. When selected, the visuals are spotlighted on the page to help you cross-check the summary output.

Dig deeper
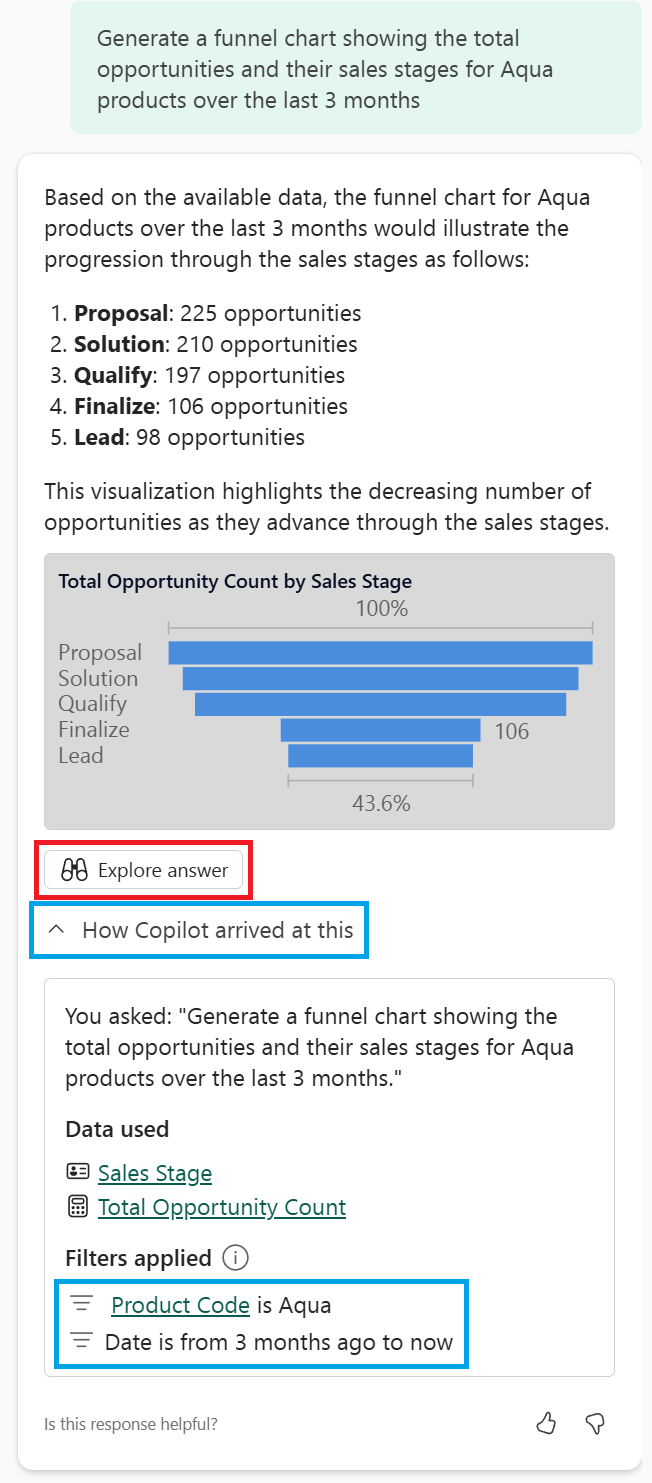
To understand how Copilot interpreted your question and ensure the correct fields, measures, or filters were chosen from your model, you can expand the "How Copilot arrived at this" dropdown. By digging into more details about the data used and filters applied, you can view or customize these details by selecting the Explore option. This allows you to quickly get the answers you need by dragging and dropping or selecting fields.
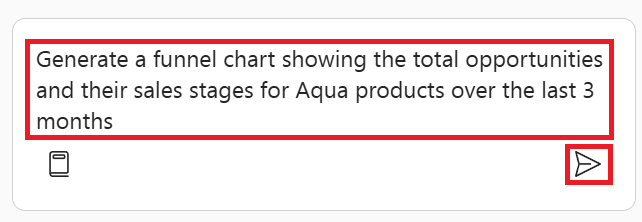
Provide Copilot with the following example instruction to continue exploring your data, and select Send or Enter to confirm:
- Generate a funnel chart showing the total opportunities and their sales stages for Aqua products over the last three months
A summarization of the data and a visual are returned as an answer to your instructions. You can expand the How Copilot arrived at this option to review the data used and understand any filters applied. In this example, relative date filters are applied based on the "last three months" condition. To explore and further customize the visual, select the Explore answer option.
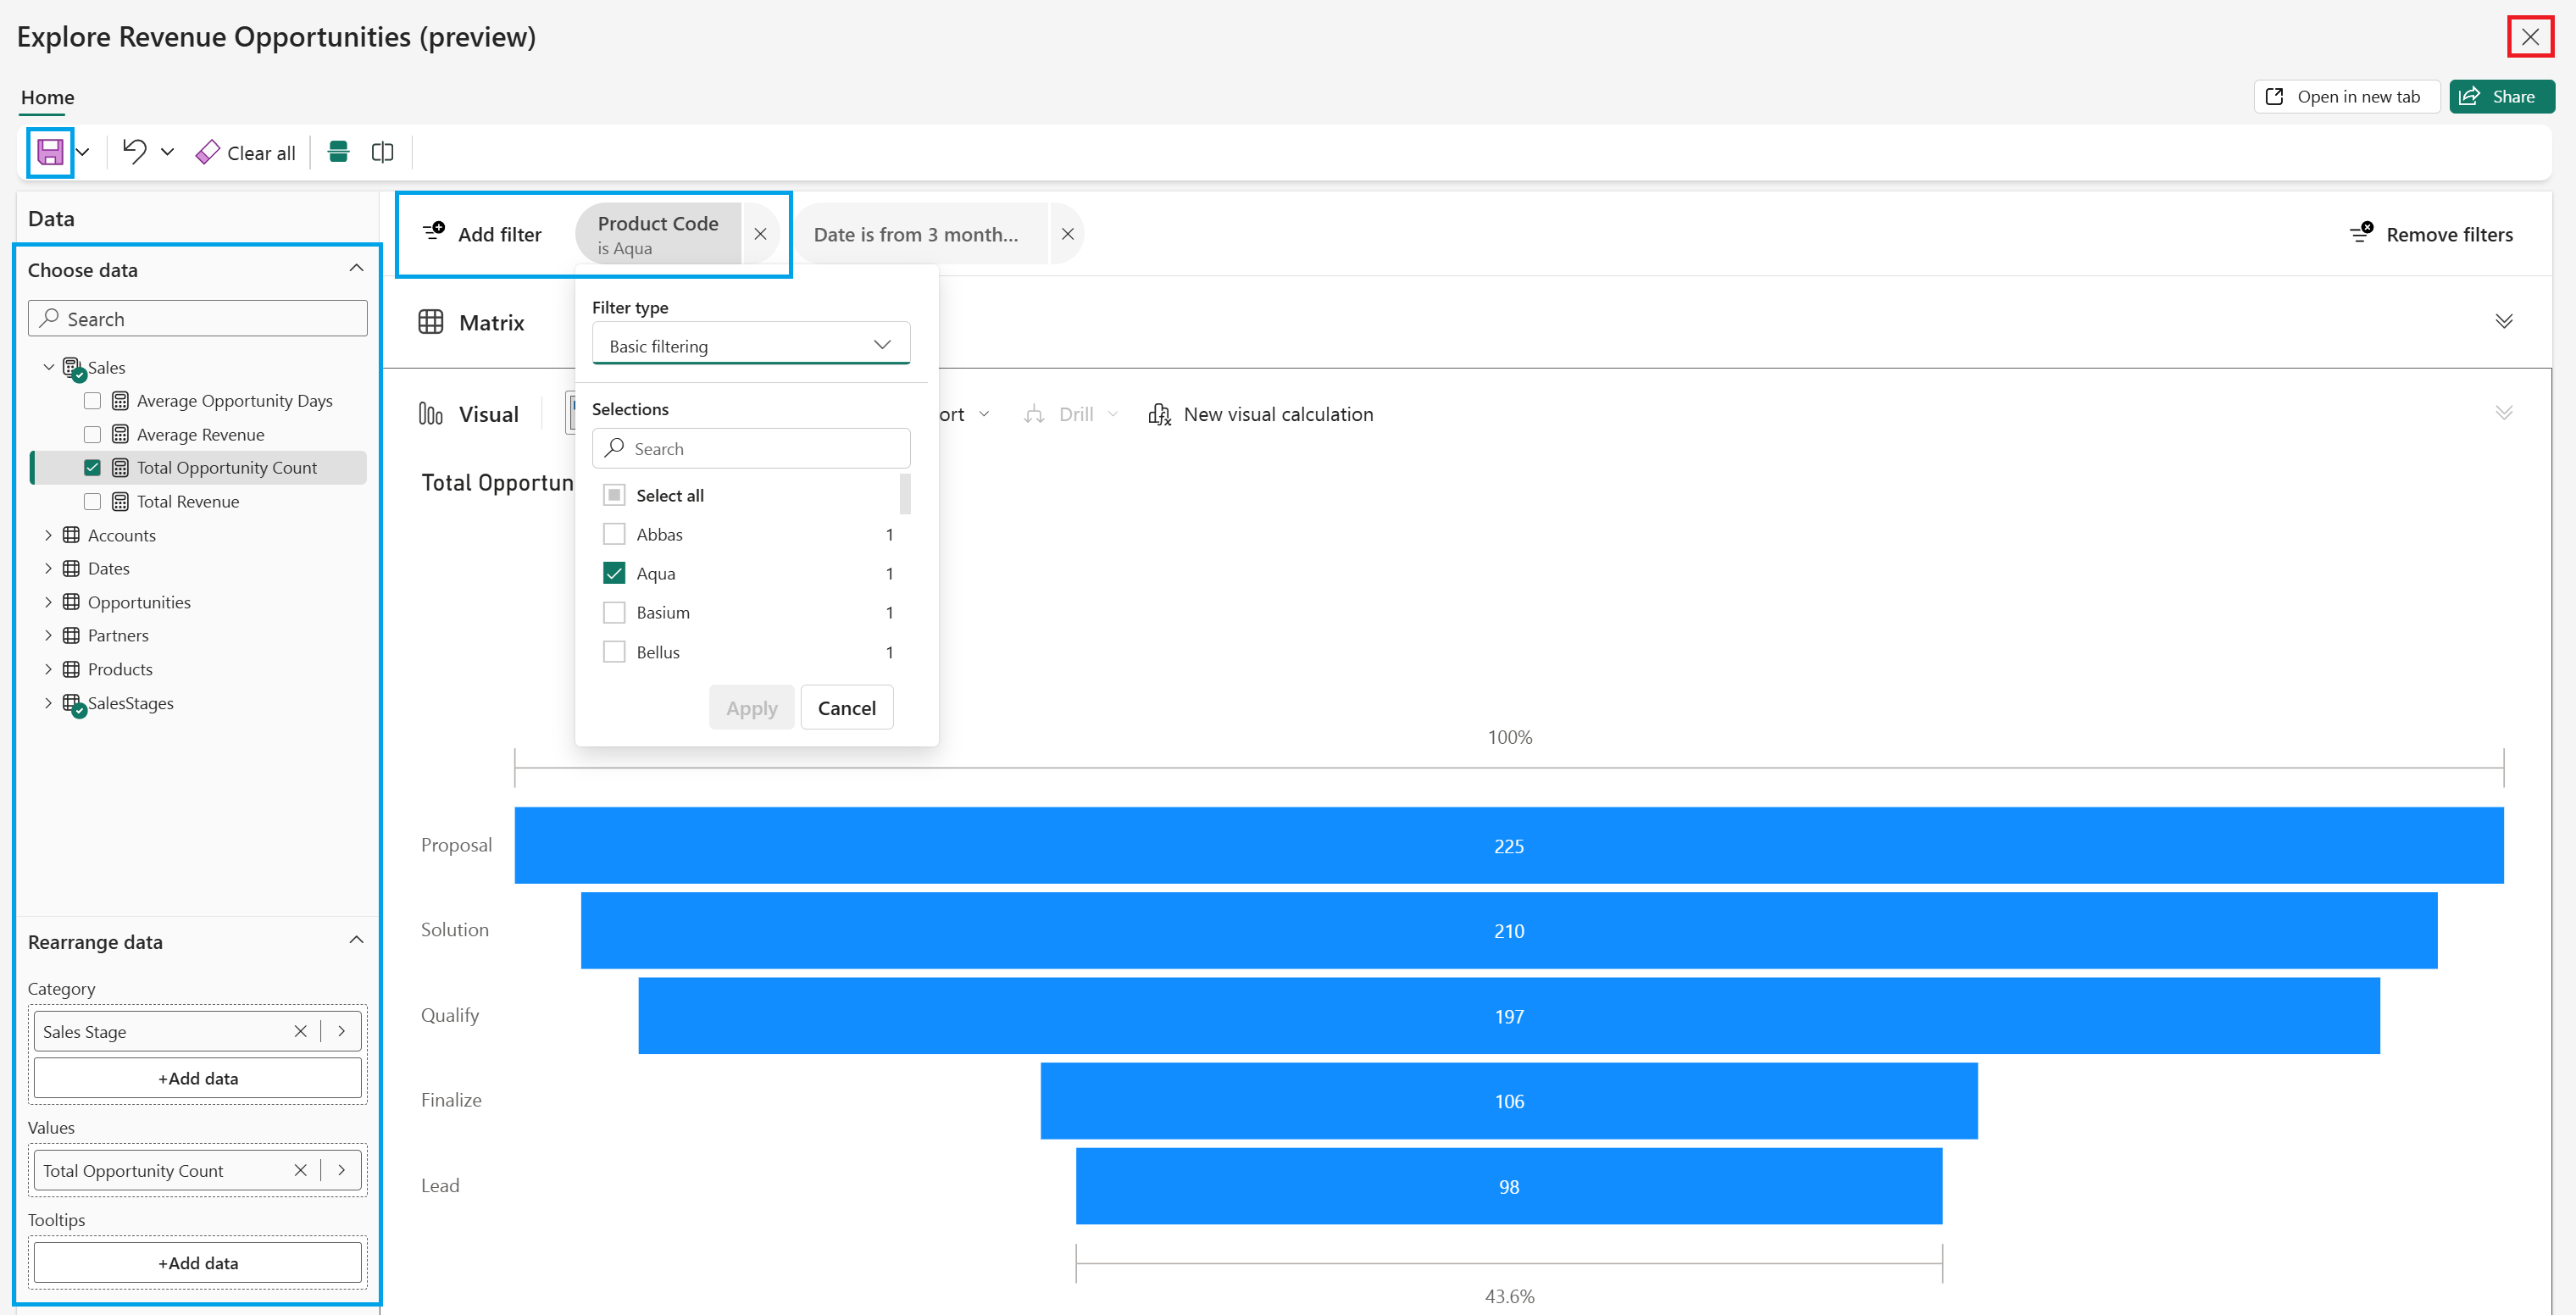
Explore allows you to interact with the visual, adding or customizing filters, rearranging the data, and more. You can also save the exploration to a workspace for continued use. To exit, select close (X) in the top right corner.
Write a summary
When generating a summary in Copilot, you can create detailed summaries for broad topics or specific inquiries in seconds, saving the time it would take to manually interpret the data. Copilot responds with a comprehensive summary tailored to your question and includes the most relevant information directly in the response, including reference footnotes. This ensures you receive insightful information, supported by your data.
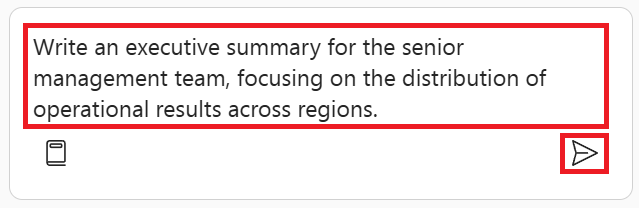
Provide Copilot with the following example instruction to write a summary about your data, and select Send or Enter to confirm:
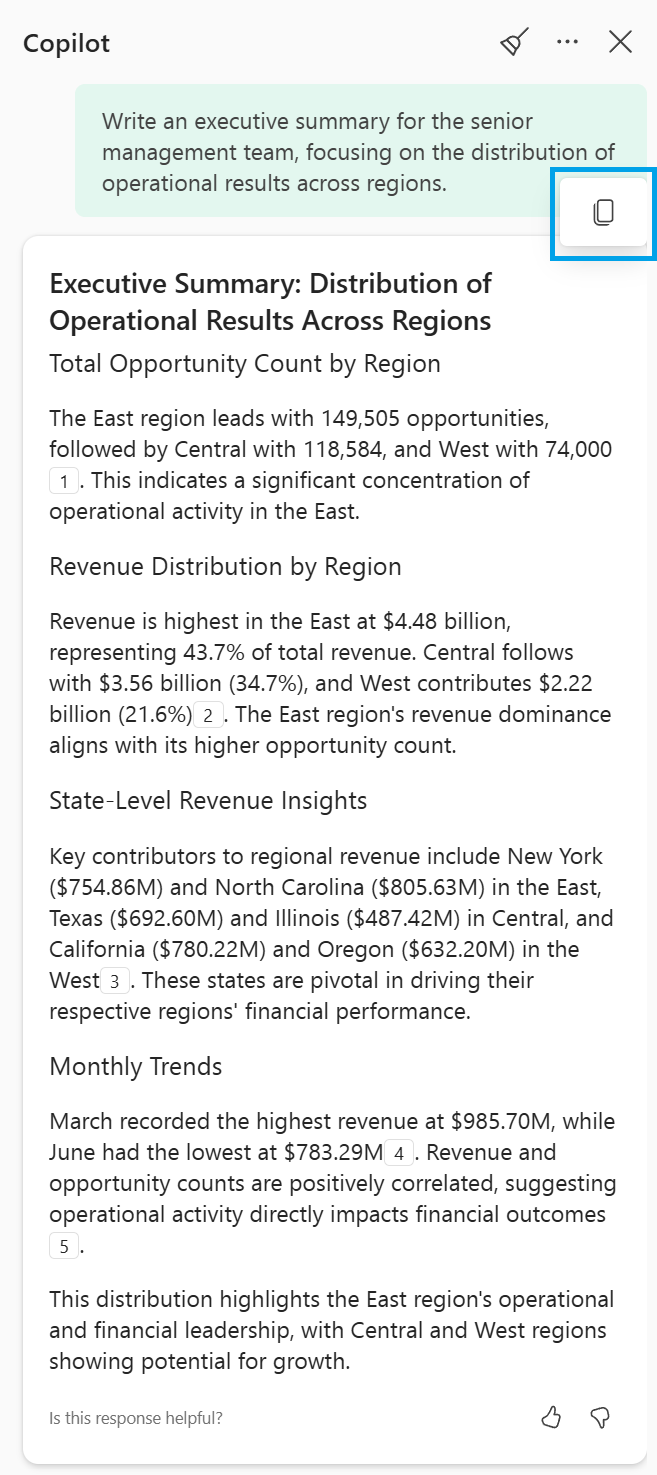
- Write an executive summary for the senior management team, focusing on the distribution of operational results across regions
A summarization of the data and a visual are returned as an answer to your instructions, including reference footnotes to highlight visuals from the report page. As you hover above the response, an option appears for you to easily copy the written summary and share with other people in your organization.