Note
Access to this page requires authorization. You can try signing in or changing directories.
Access to this page requires authorization. You can try changing directories.
APPLIES TO: ![]() Power BI Desktop
Power BI Desktop ![]() Power BI service
Power BI service
Goals in Power BI let customers curate their goals and track them against key business objectives, in a single pane. This feature enhances data culture by promoting accountability, alignment, and visibility for teams and initiatives within organizations.
License requirements
Goals are a Pro feature. Users can access various aspects of the experience depending on their license.
| Permission | Minimum requirements |
|---|---|
| Author and share scorecards and goals, and perform check-ins | Power BI Pro license |
| View scorecards and goals | Power BI Premium or Fabric F64 or greater capacity + Free user OR Power BI Pro license |
| View scorecard samples and author scorecards in My Workspace | Free user |
If you don’t meet the minimum requirements for any of these, contact your Power BI administrator before you begin.
Explore the Metrics hub page
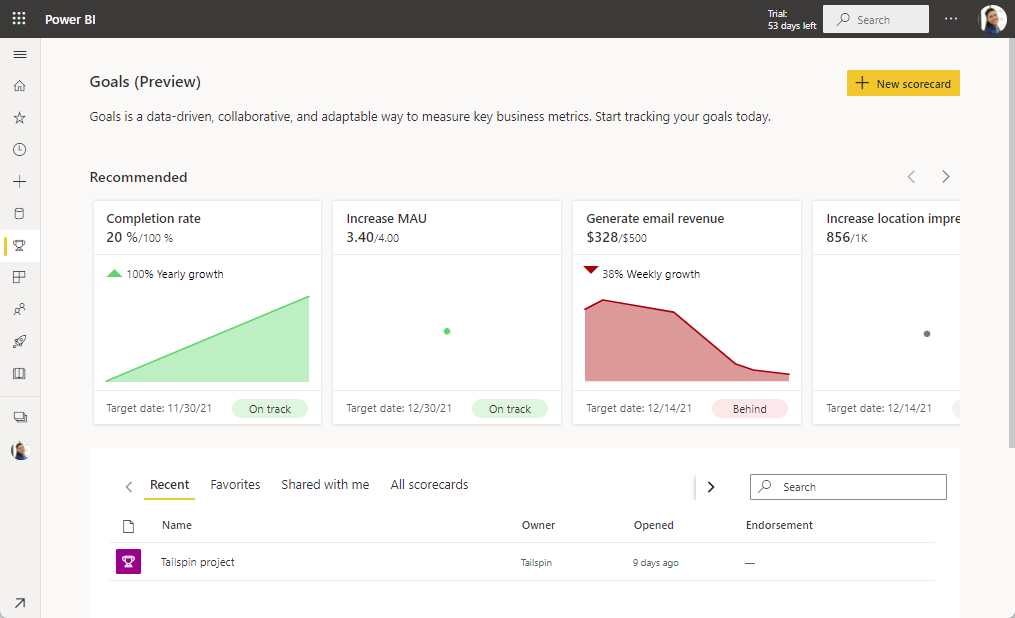
After you sign in to the Power BI service, select Metrics from the navigation pane. Power BI displays your Metrics hub page. The layout and content in the Metrics page is different for every user. As a new user, your Metrics hub page is empty, as shown in the following image.
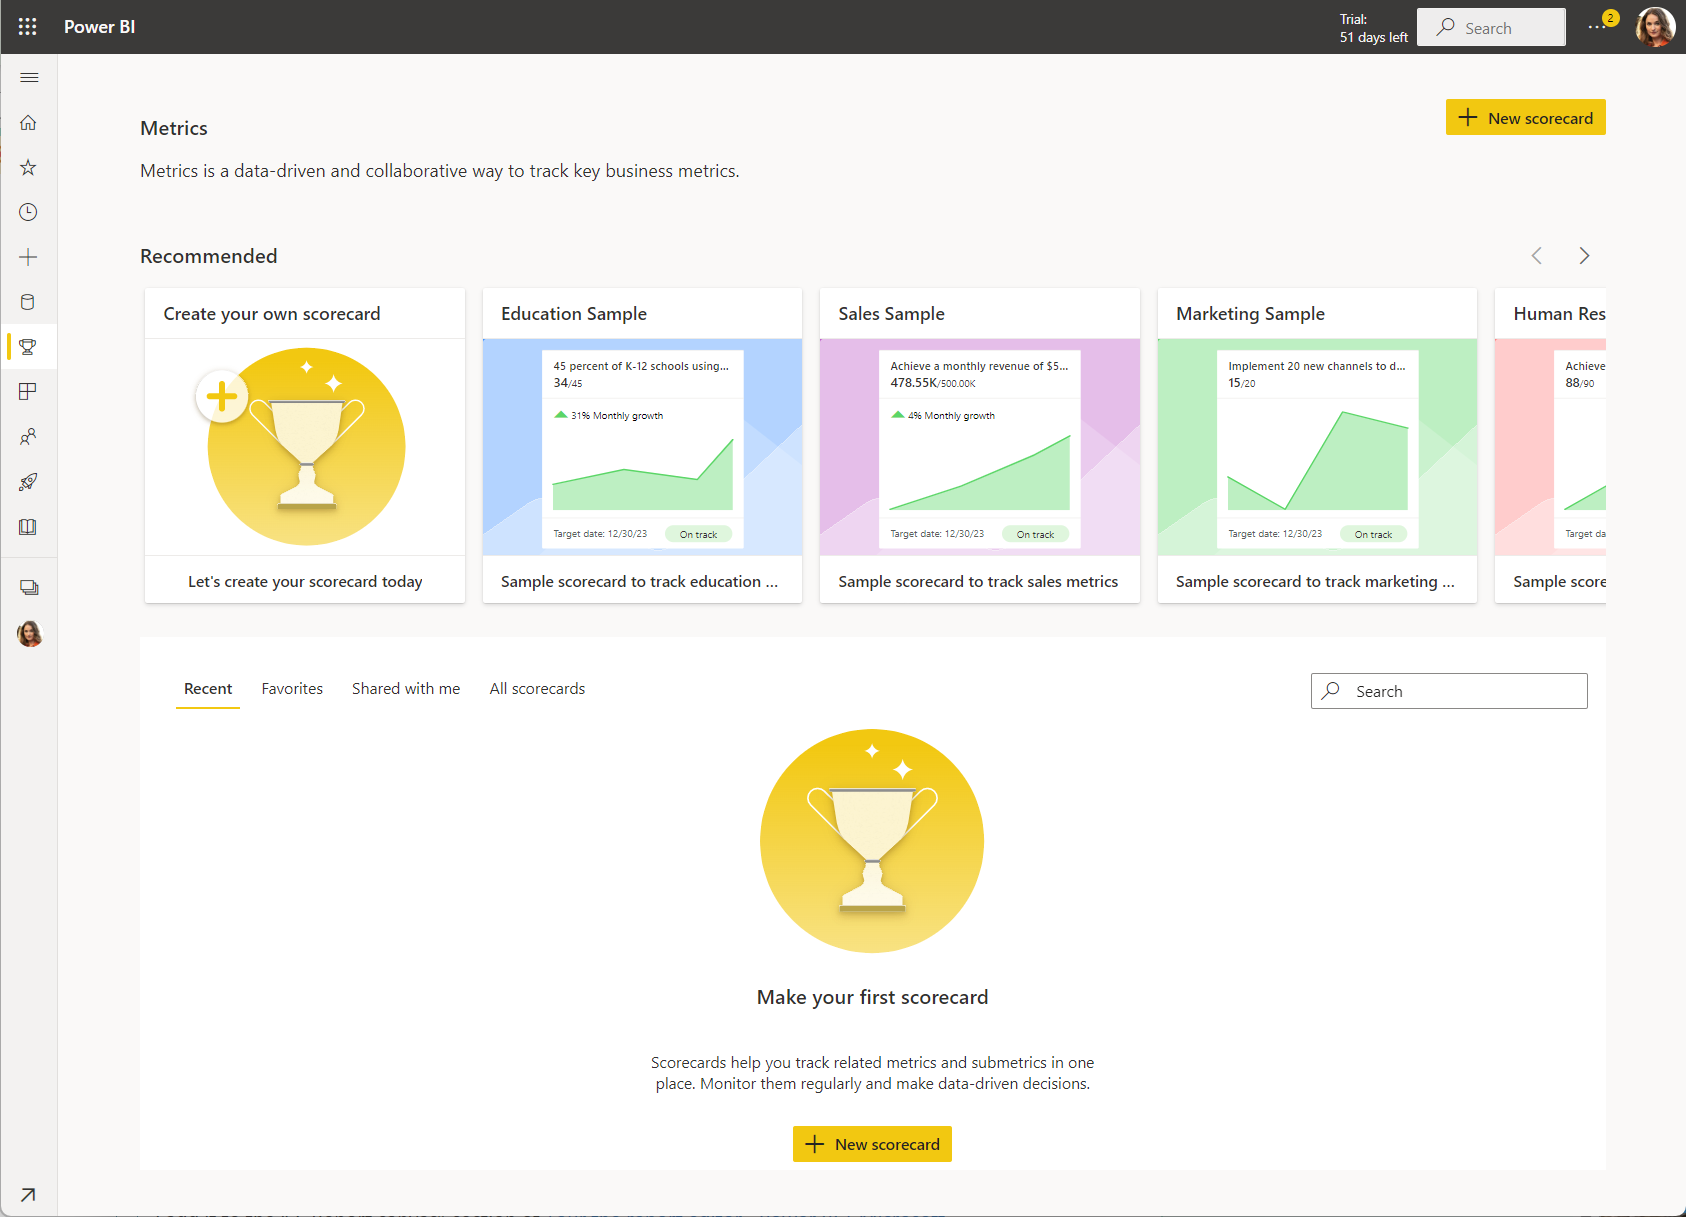
Recommended Scorecards
The top section contains all the goals that matter the most to you, and the scorecard samples. Power BI curates these scorecards automatically, based on goals that you're assigned to, you edited, or you performed a recent check-in. If you don't have any scorecards yet, you see the samples there.
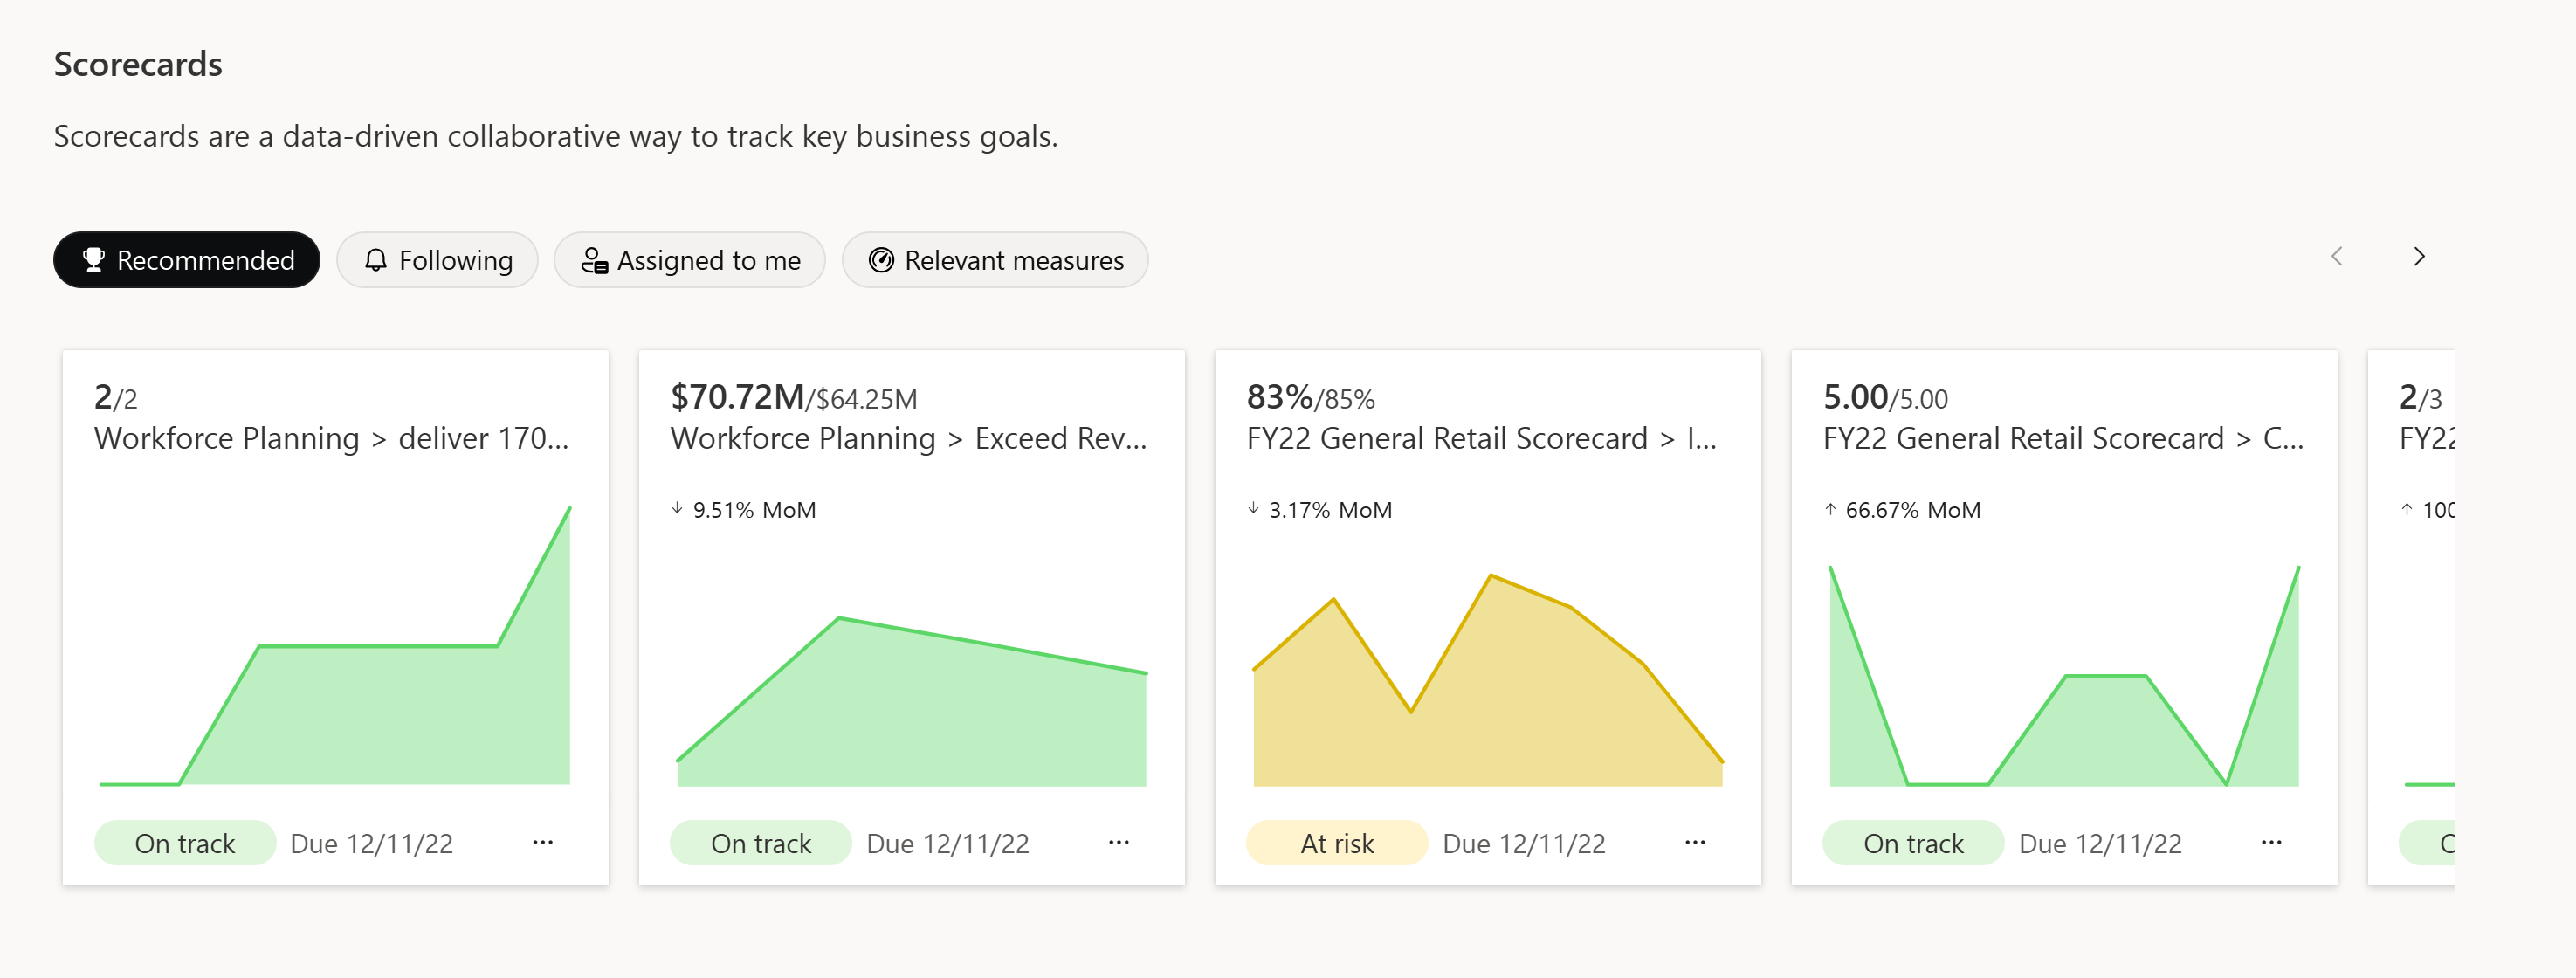
A goal must have at least two values, Current and Target, to show up in this section.
Recent, Favorites, Shared with me, and All Scorecards
The next section is a tabbed list.
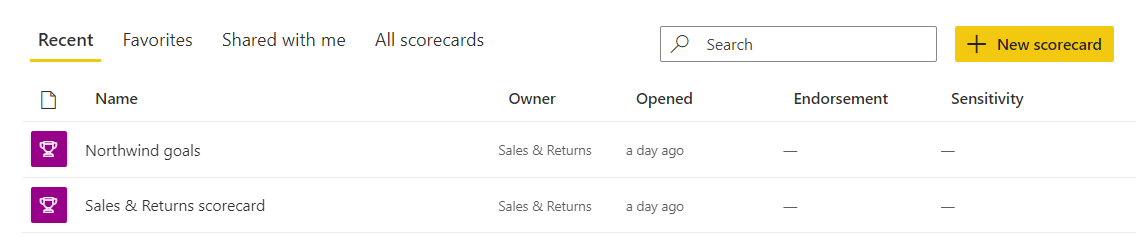
Recent are the scorecards you visited most recently. Each item has a timestamp.
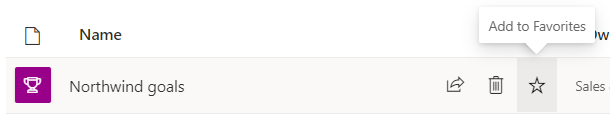
Favorites are the scorecards you starred.
Shared with me contains scorecards that your colleagues shared with you.
All scorecards lists all the scorecards you have access to.
Change the scorecard view
When you're viewing your scorecard, you can also change the view from List view to Compact view, which is currently in preview.
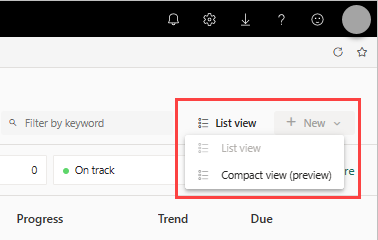
Compact view adjusts to various screen sizes and supports resizing columns. You can do everything you can do in list view, except editing and creating a new goal.
Frequently asked questions (FAQ)
Why don’t I see history for my goal when I connect to a Power BI data point?
You don’t see a history for a single data point because we only pull history for time series data. To see the history of your goal when you connect to time series data, select Track all data in this time series when you connect.
I'm connecting to time series data and still don’t see the history of the goal. Why not?
We don't pull in the history of time series if we only have a partial date, for example, day of the week or month. We can only pull in the history of a time series when we have a full date to track, such as day, month, and year.
Why aren't my goals getting updated over time in my scorecard?
There are a few reasons why your goal might not be getting updated:
- It’s a manual goal: Manual goals aren't updated automatically as they're not connected to a data source with regular refreshes. To create a history for a manual goal, do regular check-ins.
- You don't have scheduled refresh for the semantic model: Goal values are only updated as often as the semantic model is refreshed. If you don’t have a scheduled refresh on your semantic model, you don't see any updates in the goal value. Learn about scheduled refresh.
- Goals don’t get updated if they're created from a push dataset.
I'm trying to create a goal but I can’t connect to a report. Why do I see a yellow warning icon?
To connect your current value or target to data, you need build permissions for that report. Learn about build permissions.
I shared a scorecard, but my users can’t do check-ins and add notes. Why not?
Currently, users need to have edit permissions for the scorecard to add check-ins.
Why can’t I update the value as part of my check-in?
You can only update values in manual goals. If a goal value is connected to data, you can't update it manually. The data is pulled directly from the report and is updated as often as the semantic model refreshes.
How often do goals update in the scorecard?
Goals only update as often as the data updates in the semantic model. We support connecting via import, live connection, and DirectQuery. Additionally, we take snapshots of the goals data at a maximum daily cadence, and always retain the last updated value for a given day. The snapshots are always available in the underlying semantic model we create, which you can then build content on top of.
I changed the tracking cycle of my goal. Why does the data still look the same?
Changing the tracking cycle only changes the trend that you see below your value/target area. Changing this setting doesn't affect refreshes on the data or when your data is updated in the goals.
Why don’t I see the Power BI workspace I’m looking for when I create a scorecard?
In order to create a scorecard in a workspace, you need a contributor or owner role in that workspace. Learn about roles in workspaces.
Scorecards do have goal-level permissions roles. While workspace permissions give view or build access to the workspace, goal-level permissions restrict access. Certain people can only see certain goals and perform check-ins within a scorecard. Read more about goal-level permissions in scorecards.
Issues and limitations
- Goals don't support bring your own key (BYOK).
- Goals don't support row-level security (RLS).
- The maximum number of subgoal levels is four.
- Goals don't support publish-to-web.
- The scorecard visual does not work in Sharepoint embed
- Business-to-business sharing (sharing across tenants) isn't supported.
- Scorecards aren't supported in a Multi-Geo capacity.
- Scorecards aren't supported in embedded analytics.
Related content
- Create scorecards and manual goals in Power BI
- Create connected goals in Power BI
- Stay on top of your goals in Power BI
- Protect your scorecard with goal-level permissions
- Metrics admin settings
More questions? Try the Power BI Community.