Note
Access to this page requires authorization. You can try signing in or changing directories.
Access to this page requires authorization. You can try changing directories.
Important
To add the new Format pane to a custom visual, we recommend using formattingmodel utils.
Although we recommend using formattingmodel utils with the new format pane, this example demonstrates how to build a custom visual formatting model with one card using only the API.
Example: Formatting a data card
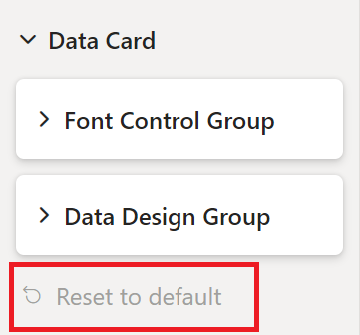
The card has two groups:
- Font control group with one composite property
- Font control
- Data design group with two simple properties
- Font color
- Line alignment
First, add objects to capabilities file:
"objects": {
        "dataCard": {
            "properties": {
                "displayUnitsProperty": {
                    "type":
                    {
                        "formatting": {
                            "labelDisplayUnits": true
                        }
                    }
                },
                "fontSize": {
                    "type": {
                        "formatting": {
                            "fontSize": true
                        }
                    }
                },
                "fontFamily": {
                    "type": {
                        "formatting": {
                            "fontFamily": true
                        }
                    }
                },
                "fontBold": {
                    "type": {
                        "bool": true
                    }
                },
                "fontUnderline": {
                    "type": {
                        "bool": true
                    }
                },
                "fontItalic": {
                    "type": {
                        "bool": true
                    }
                },
                "fontColor": {
                    "type": {
                        "fill": {
                            "solid": {
                                "color": true
                            }
                        }
                    }
                },
                "lineAlignment": {
                    "type": {
                        "formatting": {
                            "alignment": true
                        }
                    }
                }
            }
        }
    }
Then, create the getFormattingModel
    public getFormattingModel(): powerbi.visuals.FormattingModel {
        // Building data card, We are going to add two formatting groups "Font Control Group" and "Data Design Group"
        let dataCard: powerbi.visuals.FormattingCard = {
            description: "Data Card Description",
            displayName: "Data Card",
            uid: "dataCard_uid",
            groups: []
        }

        // Building formatting group "Font Control Group"
        // Notice that "descriptor" objectName and propertyName should match capabilities object and property names
        let group1_dataFont: powerbi.visuals.FormattingGroup = {
            displayName: "Font Control Group",
            uid: "dataCard_fontControl_group_uid",
            slices: [
                {
                    uid: "dataCard_fontControl_displayUnits_uid",
                    displayName:"display units",
                    control: {
                        type: powerbi.visuals.FormattingComponent.Dropdown,
                        properties: {
                            descriptor: {
                                objectName: "dataCard",
                                propertyName:"displayUnitsProperty"
                            },
                            value: 0
                        }
                    }
                },
                // FontControl slice is composite slice, It means it contain multiple properties inside it
                {
                    uid: "data_font_control_slice_uid",
                    displayName: "Font",
                    control: {
                        type: powerbi.visuals.FormattingComponent.FontControl,
                        properties: {
                            fontFamily: {
                                descriptor: {
                                    objectName: "dataCard",
                                    propertyName: "fontFamily"
                                },
                                value: "wf_standard-font, helvetica, arial, sans-serif"
                            },
                            fontSize: {
                                descriptor: {
                                    objectName: "dataCard",
                                    propertyName: "fontSize"
                                },
                                value: 16
                            },
                            bold: {
                                descriptor: {
                                    objectName: "dataCard",
                                    propertyName: "fontBold"
                                },
                                value: false
                            },
                            italic: {
                                descriptor: {
                                    objectName: "dataCard",
                                    propertyName: "fontItalic"
                                },
                                value: false
                            },
                            underline: {
                                descriptor: {
                                    objectName: "dataCard",
                                    propertyName: "fontUnderline"
                                },
                                value: false
                            }
                        }
                    }
                }
            ],
        };
        // Building formatting group "Font Control Group"
        // Notice that "descriptor" objectName and propertyName should match capabilities object and property names
        let group2_dataDesign: powerbi.visuals.FormattingGroup = {
            displayName: "Data Design Group",
            uid: "dataCard_dataDesign_group_uid",
            slices: [
                // Adding ColorPicker simple slice for font color
                {
                    displayName: "Font Color",
                    uid: "dataCard_dataDesign_fontColor_slice",
                    control: {
                        type: powerbi.visuals.FormattingComponent.ColorPicker,
                        properties: {
                            descriptor:
                            {
                                objectName: "dataCard",
                                propertyName: "fontColor"
                            },
                            value: { value: "#01B8AA" }
                        }
                    }
                },
                // Adding AlignmentGroup simple slice for line alignment
                {
                    displayName: "Line Alignment",
                    uid: "dataCard_dataDesign_lineAlignment_slice",
                    control: {
                        type: powerbi.visuals.FormattingComponent.AlignmentGroup,
                        properties: {
                            descriptor:
                            {
                                objectName: "dataCard",
                                propertyName: "lineAlignment"
                            },
                            mode: powerbi.visuals.AlignmentGroupMode.Horizonal,
                            value: "right"
                        }
                    }
                },
            ]
        };

        // Add formatting groups to data card
        dataCard.groups.push(group1_dataFont);
        dataCard.groups.push(group2_dataDesign);

        // Build and return formatting model with data card
        const formattingModel: powerbi.visuals.FormattingModel = { cards: [dataCard] };
        return formattingModel;
    }
Here's the resulting pane:

Reset settings to default
The new format pane has the option to reset all formatting card properties values to default by clicking on the Reset to default button that appears in the open card.

To enable this feature, add a list of formatting card properties descriptors to formatting card revertToDefaultDescriptors.
The following the example shows how to add the reset to default button:
let dataCard: powerbi.visuals.FormattingCard = {
    displayName: "Data Card",
    // ... card parameters and groups list

    revertToDefaultDescriptors: [
        {
            objectName: "dataCard",
            propertyName:"displayUnitsProperty"
        },
        {
            objectName: "dataCard",
            propertyName: "fontFamily"
        },

        // ... the rest of properties descriptors
    ]
};
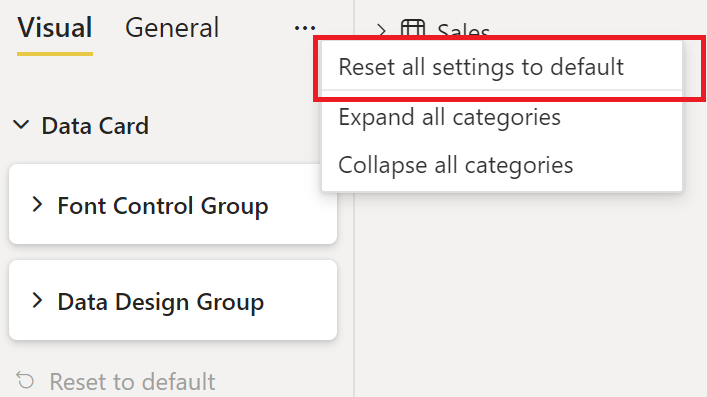
Adding revertToDefaultDescriptors to formatting cards also makes it possible to reset all formatting cards properties at once by clicking on the reset all settings to default button in the top bar of the format pane:

Formatting property selector
The optional selector in formatting properties descriptor determines where each property is bound in the dataView. There are four distinct options. Read about them in objects selectors types.
Localization
For more about the localization feature and to set up a localization environment see Add the local language to your Power BI visual Use the localization manager to format components that you want to localize:
displayName: this.localization.getDisplayName("Font_Color_DisplayNameKey");
description: this.localization.getDisplayName("Font_Color_DescriptionKey");
To localize formatting model utils formatting utils localization.
GitHub Resources
All formatting model interfaces can be found in GitHub - microsoft/powerbi-visuals-api: Power BI custom visuals API in “formatting-model-api.d.ts”
We recommend using the new formatting model utils at GitHub - microsoft/powerbi-visuals-utils-formattingmodel: Power BI visuals formatting model helper utils
You can find an example of a custom visual SampleBarChart that uses API version 5.1.0 and implements
getFormattingModelusing the new formatting model utils at GitHub - microsoft/PowerBI-visuals-sampleBarChart: Bar Chart Custom Visual for tutorial.
Related content
More questions? Ask the Power BI Community