Note
Access to this page requires authorization. You can try signing in or changing directories.
Access to this page requires authorization. You can try changing directories.
This article describes how to build a funnel plot using R script in R visual step by step. Source files are available for download under each set of steps.
In this article, you learn how to create:
- an R-script for RStudio
- an R-visual in Power BI
- a PNG-based R-powered Visual in Power BI
- a HTML-based R-powered Visual in Power BI
The funnel plot provides an easy way to consume, interpret, and show the amount of expected variation. The funnel is formed using confidence limits and outliers are shown as dots outside the funnel.
In this example the funnel plot is used to compare and analyze various sets data.
Prerequisites
Get a Microsoft Fabric subscription. Or, sign up for a free Microsoft Fabric trial.
Install pbiviz tools.
Build an R script with semantic model
Download a minimal R script and its data table, dataset.csv.
Next, edit the script to mirror this script. This adds input error handling and user parameters to control the plot's appearance.
Build a report
Next, edit the script to mirror this script. This loads dataset.csv instead of read.csv into the Power BI desktop workspace and creates a Cancer Mortality table. See the results in the following PBIX file.
Note
The dataset is a hard-coded name for the input data.frame of any R-visual.
Create an R-powered visual and package in R code
Run the following command to create a new R-powered visual:
pbiviz new funnel-visual -t rvisual
cd funnel-visual
npm install
pbiviz package
This command creates the folder funnel-visual with initial template visual (
-tfor template). The PBIVIZ can be found in the dist folder, the R-code inside script.r file. Try to import it into Power BI and see what happens.Edit script.r file and replace the contents with your previous script.
Edit capabilities.json and replace the string
Valueswithdataset. This replaces the name of "Role" in the template to be like in R-code.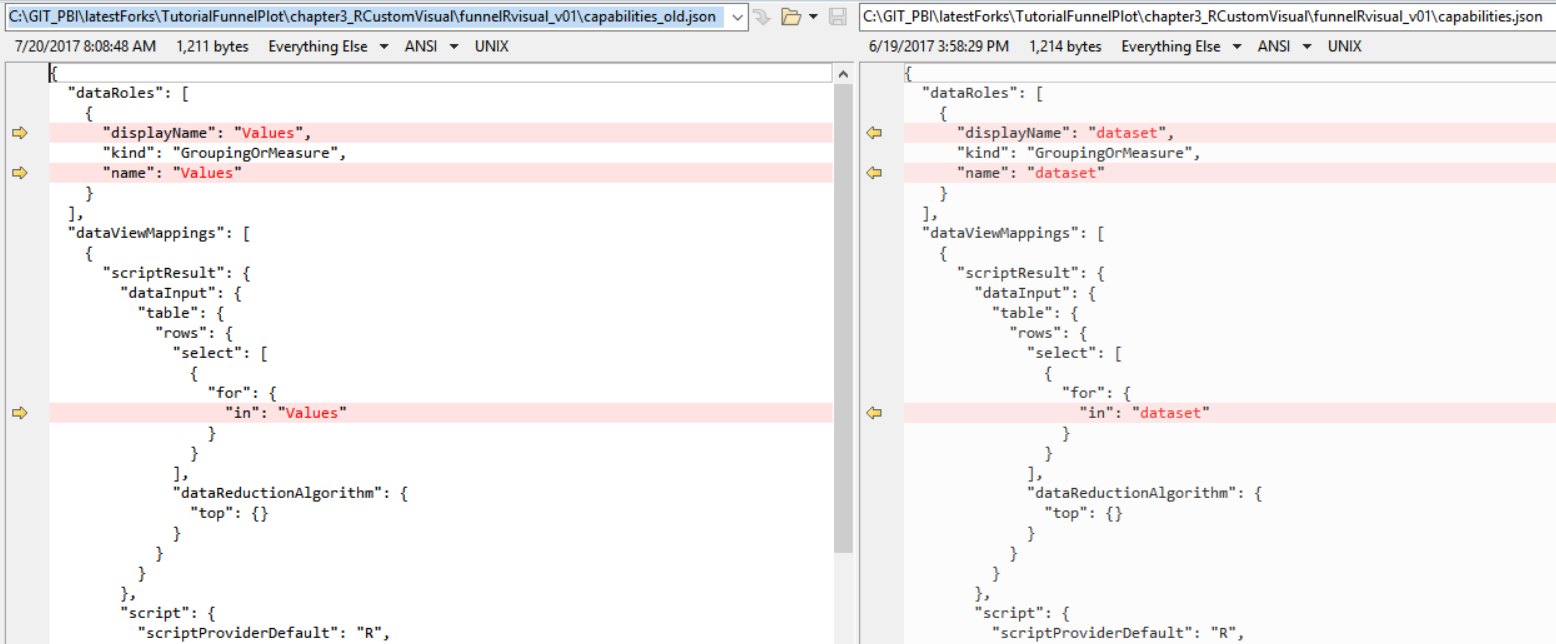
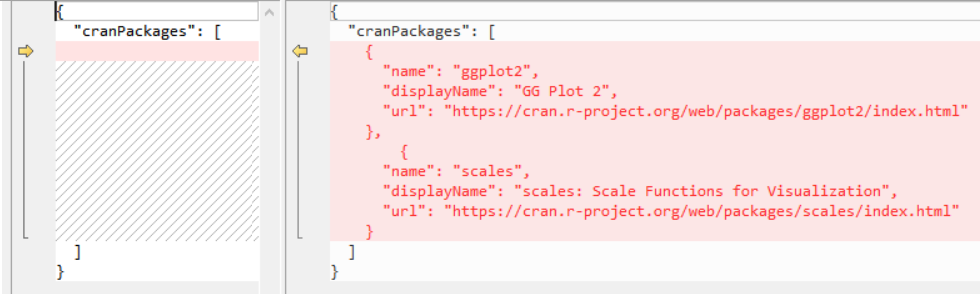
(optional) Edit dependencies.json and add a section for each R package required by the R script. This tells Power BI to automatically import these packages when the visual is loaded for the first time.
Repackage the visual using the
pbiviz packagecommand and try to import it into Power BI.
Note
See PBIX and source code for download.
Make R-based visual improvements
The visual isn't yet user-friendly because the user has to know the order of columns in the input table.
Divide the input field
datasetinto three fields (roles):Population,Number, andTooltips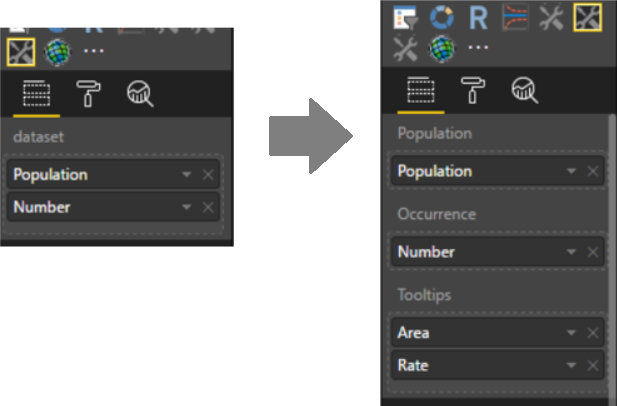
Edit capabilities.json and replace the
datasetrole with the three new roles, or download capabilities.json.You'll need to update sections:
dataRolesanddataViewMappings, which define names, types, tooltips, and maximum columns for each input field.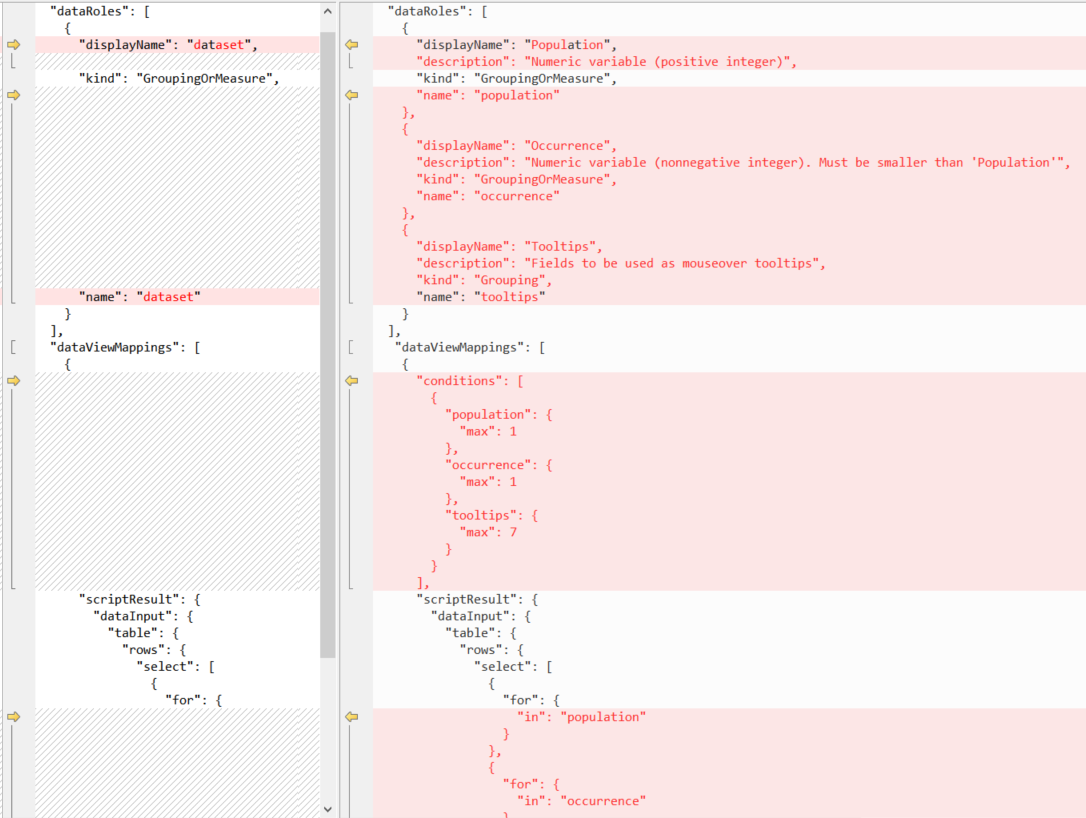
For more information, see capabilities.
Edit script.r to support
Population,NumberandTooltipsas input dataframes instead ofdataset, or download script.r.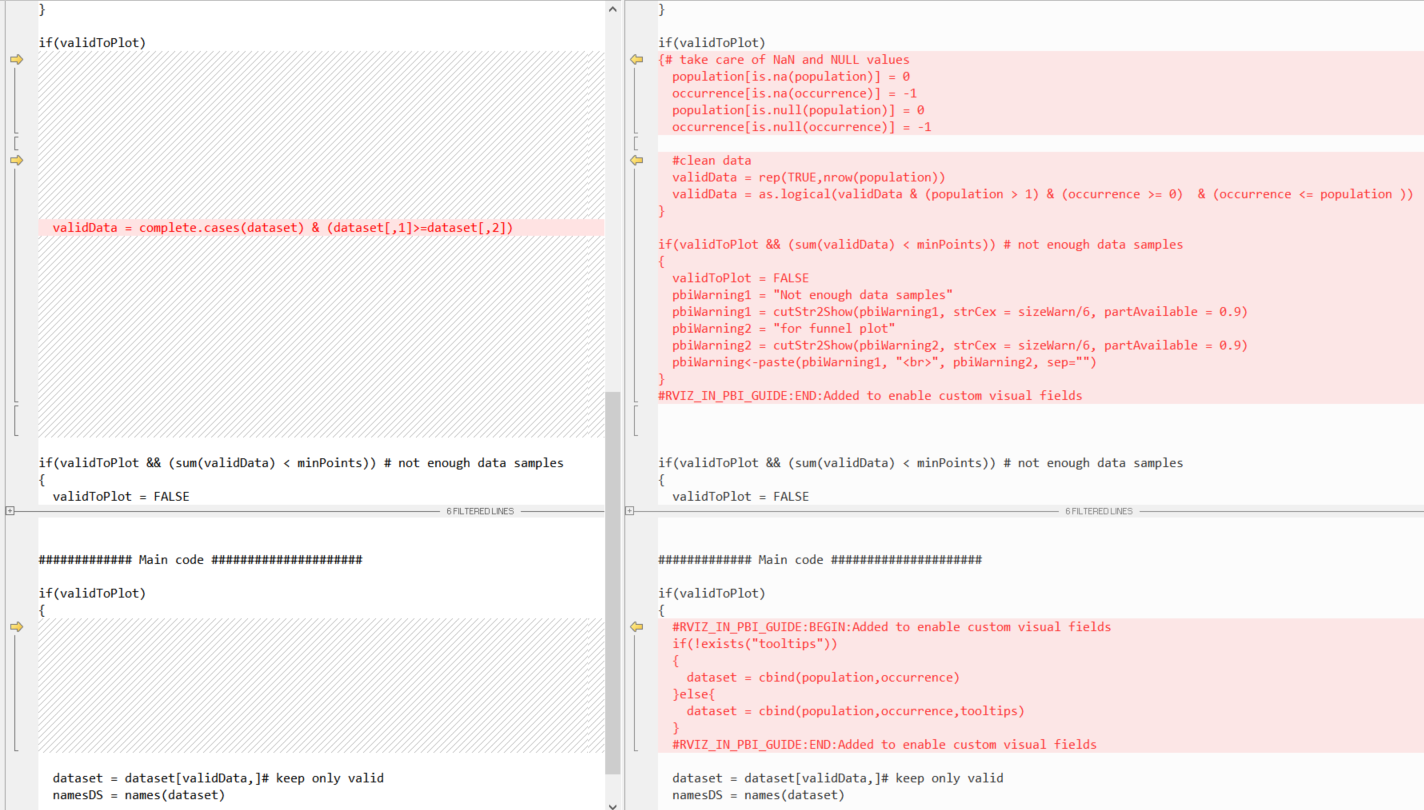
Tip
To follow the changes in R-script, search for comment blocks:
#RVIZ_IN_PBI_GUIDE:BEGIN: Added to enable visual fields
...
#RVIZ_IN_PBI_GUIDE:END: Added to enable visual fields

#RVIZ_IN_PBI_GUIDE:BEGIN: Removed to enable visual fields
...
#RVIZ_IN_PBI_GUIDE:BEGIN: Removed to enable visual fields
Repackage the visual using the
pbiviz packagecommand and try to import it into Power BI.
Note
See PBIX and source code for download.
Add user parameters
Add capabilities for the user to control colors and sizes of visual elements including internal parameters from the UI.
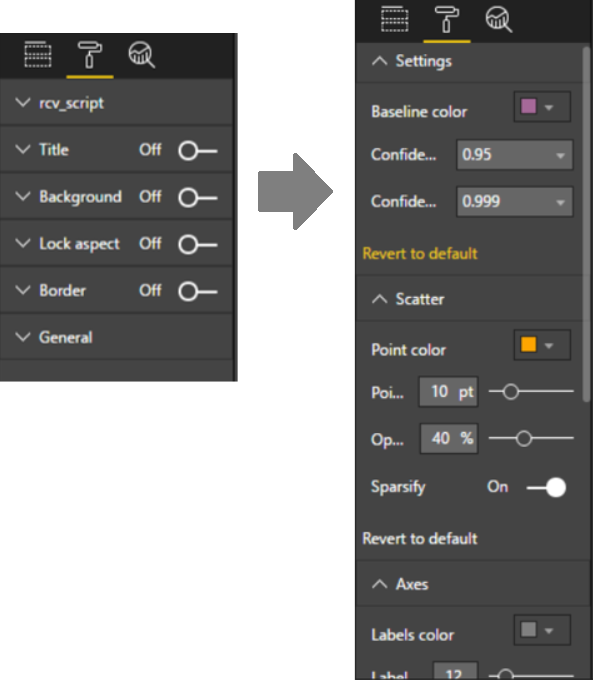
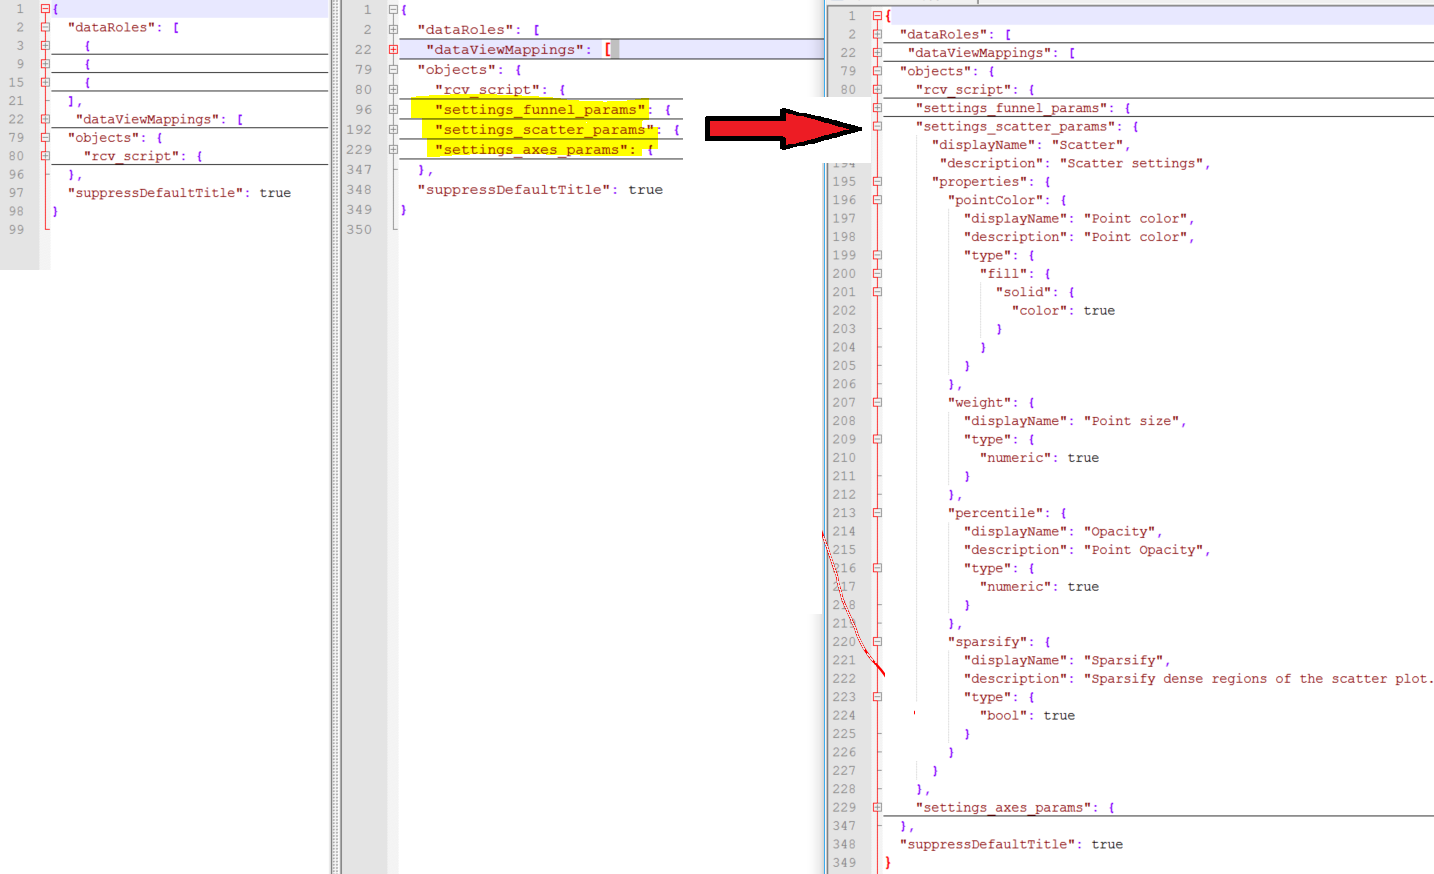
Edit capabilities.json and update the
objectssection. Here we define names, tooltips and types of each parameter, and also decide on the partition of parameters into groups (three groups in this case).download capabilities.json, see object properties for more information
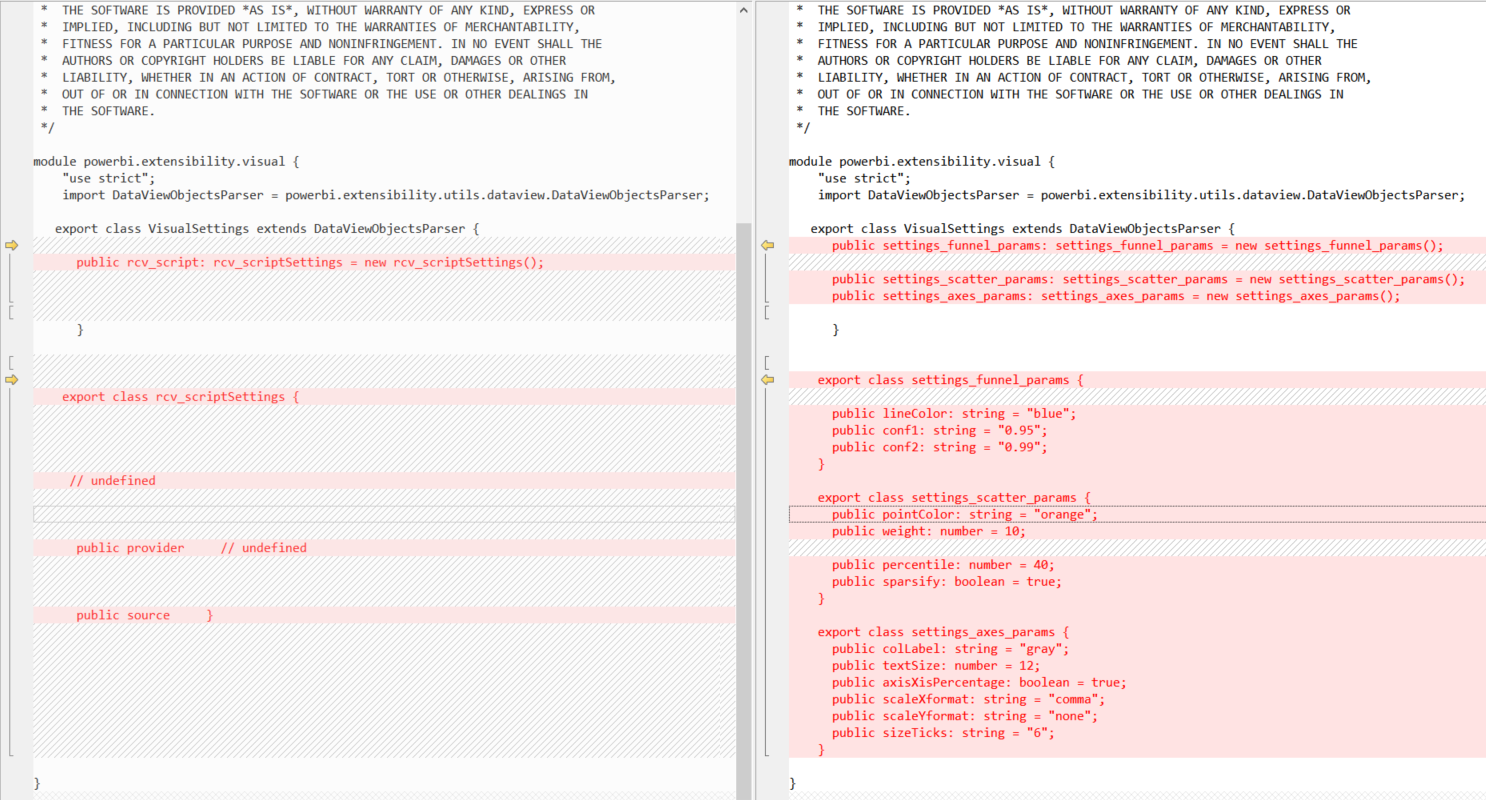
Edit src/settings.ts to mirror this settings.ts. This file is written in TypeScript.
Here you'll find two blocks of the code added to:
- Declare new interface to hold the property value
- Define a member property and default values
Edit script.r to mirror this script.r. This adds support for the parameters in the UI by adding
if.existscalls per user-parameter.Tip
To follow the changes in R-script, search for comments:
#RVIZ_IN_PBI_GUIDE:BEGIN:Added to enable user parameters
 ...
#RVIZ_IN_PBI_GUIDE:END:Added to enable user parameters

#RVIZ_IN_PBI_GUIDE:BEGIN:Removed to enable user parameters
 ...
#RVIZ_IN_PBI_GUIDE:END:Removed to enable user parameters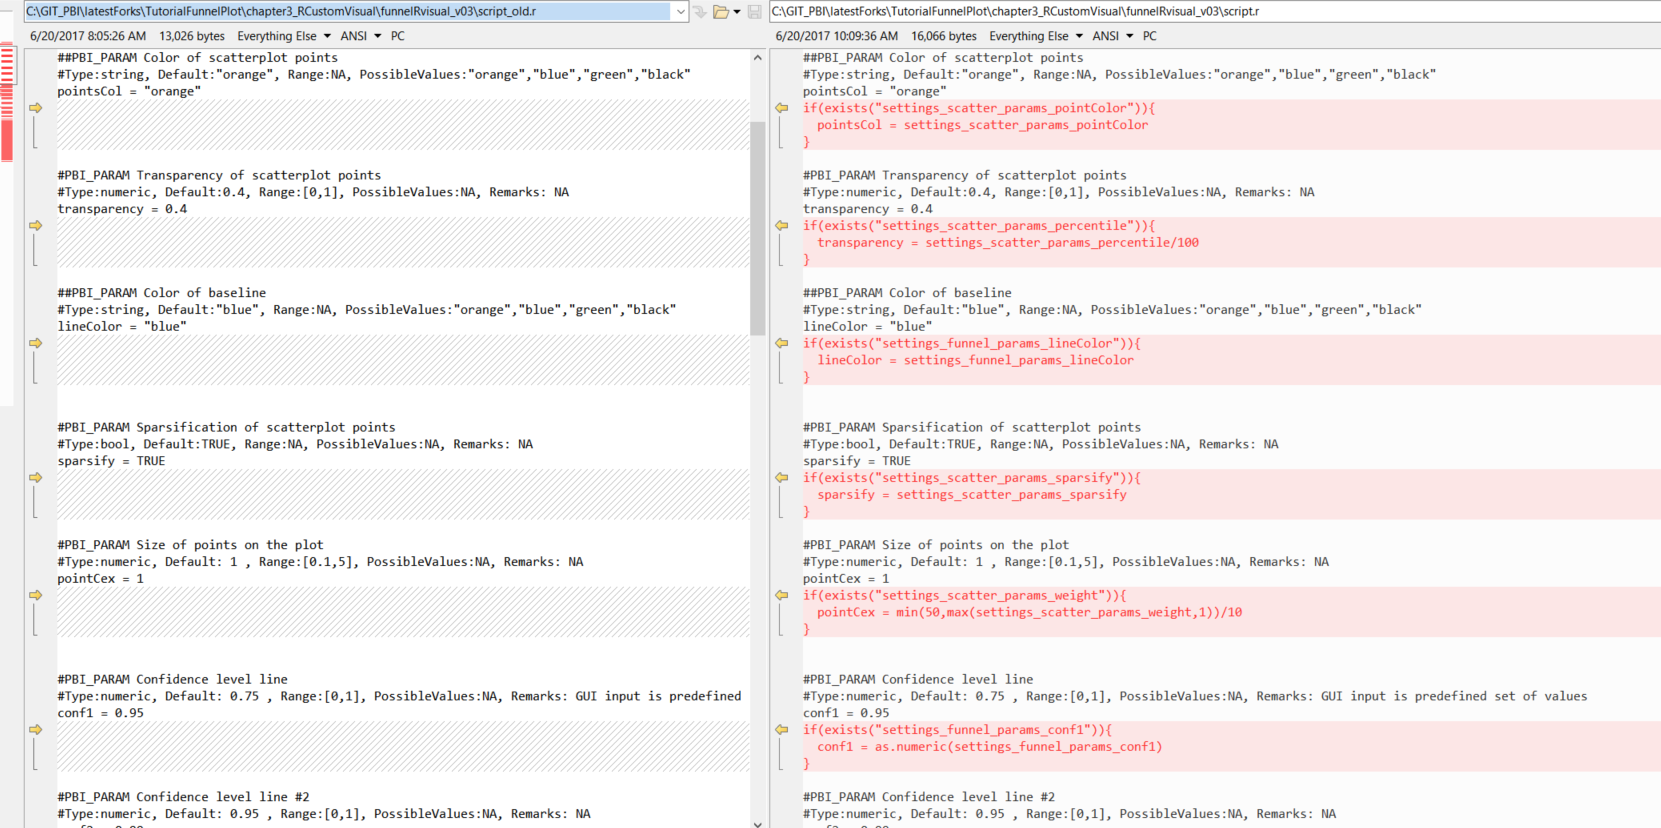
You can decide not to expose the parameters to the UI, like we did.
Repackage the visual using the
pbiviz packagecommand and try to import it into Power BI.
Note
See PBIX and source code for download.
Tip
Here we added parameters of several types (boolean, numeric, string, and color) all at once. For a simple case, please see this example on how to add a single parameter.
Convert visual to RHTML-based visual
Since the resulting visual is PNG-based, it isn't responsive to mouse hover, can't be zoomed in on, and so on, so we need to convert it to an HTML-based visual. We'll create an empty R-powered HTML-based Visual template, then copy some scripts from the PNG-based project.
Run the command:
pbiviz new funnel-visual-HTML -t rhtml
cd funnel-visual-HTML
npm install
pbiviz package
Open capabilities.json and note the
"scriptOutputType":"html"line.Open dependencies.json and note the names of the listed R-packages.
Open script.r and note the structure. You can open and run it in RStudio since it doesn't use external input.
This creates and saves out.html. This file is self-contained (with no external dependencies) and defines the graphics inside the HTML widget.
Important
For
htmlWidgetsusers, R-utilities are provided in the r_files folder to help convertplotlyorwidgetobjects into self-content HTML.This version of R-powered visual also supports the
sourcecommand (unlike previous types of visuals), to make your code more readable.Replace capabilities.json with the capabilities.json from the previous step, or download capabilities.json.
Be sure to keep:
"scriptOutputType": "html"Merge the latest version of script.r with the script.r from the template, or download script.r.
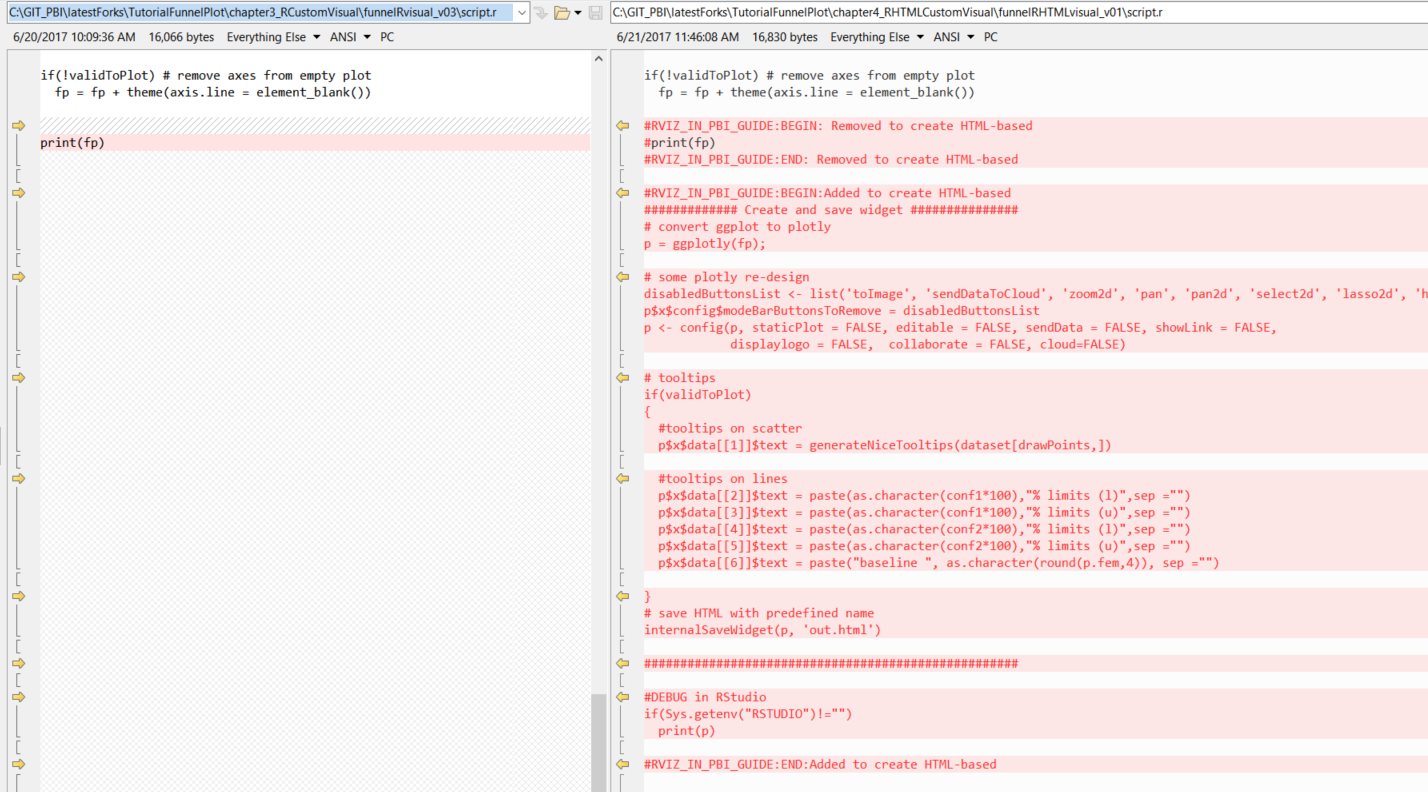
The new script uses the
plotlypackage to convert the ggplot object into a plotly object, then thehtmlWidgetspackage to save it to an HTML file.Most of the utility functions are moved to r_files/utils.r and the
generateNiceTooltipsfunction is added for the appearance of the plotly object.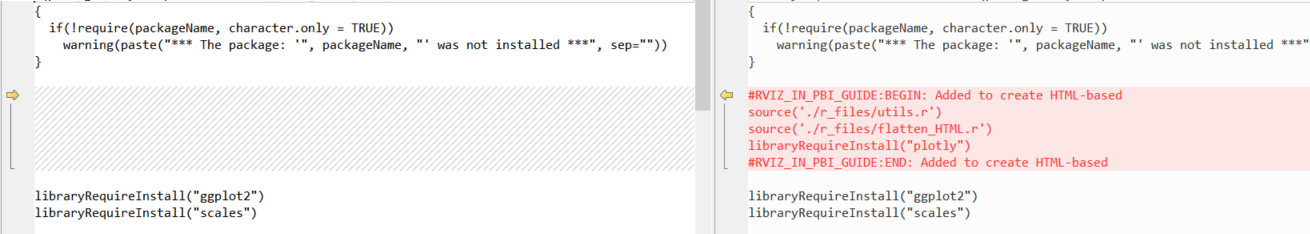
Tip
To follow the changes in R-script, search for comments:
#RVIZ_IN_PBI_GUIDE:BEGIN:Added to create HTML-based
 ...
#RVIZ_IN_PBI_GUIDE:BEGIN:Added to create HTML-based

#RVIZ_IN_PBI_GUIDE:BEGIN:Removed to create HTML-based
...
#RVIZ_IN_PBI_GUIDE:BEGIN:Removed to create HTML-based
Merge the latest version of dependencies.json with the dependencies.json from the template, to include new R-package dependencies, or download dependencies.json.
Edit src/settings.ts the same way from previous steps.
Repackage the visual using the
pbiviz packagecommand and try to import it into Power BI.
Note
See PBIX and source code for download.
Build additional examples
Run the following command to create an empty project:
pbiviz new example -t rhtml
cd example
npm install
pbiviz package
Take code from this showcase and make the highlighted changes:
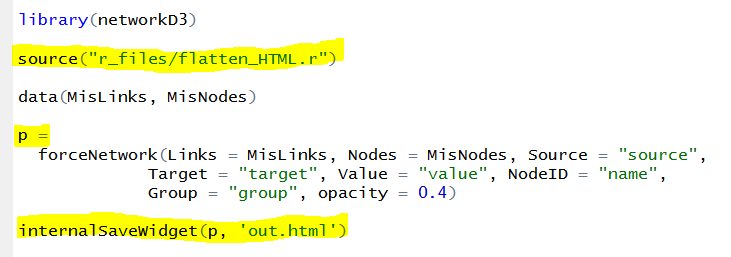
Replace your template's script.r and run
pbiviz packageagain. Now the visual is included in your Power BI report!
Tips and tricks
We recommend that developers edit pbiviz.json to store correct metadata, such as version, email, name, license type, and so on.
Important
The guid field is the unique identifier for a visual. If you create a new project for each visual, the GUID will be also be different. It's only the same when using an old project copied to a new visual, which you shouldn't do.
Edit assets/icon.png to create unique icons for your visual.
To debug R-code in RStudio using the same data as in your Power BI report, add the following to the beginning of the R-script (edit the
fileRdavariable):#DEBUG in RStudio fileRda = "C:/Users/yourUserName/Temp/tempData.Rda" if(file.exists(dirname(fileRda))) { if(Sys.getenv("RSTUDIO")!="") load(file= fileRda) else save(list = ls(all.names = TRUE), file=fileRda) }This saves the environment from a Power BI report and loads it into RStudio.
You don't need to develop R-powered Visuals from scratch with code available on GitHub. You can select the visual to use as a template and copy the code into a new project.
For example, try using the spline custom visual.
Each R Visual applies the
uniqueoperator to its input table. To avoid identical rows being removed, consider adding an extra input field with a unique ID and ignore it in the R code.If you have a Power BI account, use the Power BI service to develop a visual on-the-fly instead of repackaging them with the
pbiviz packagecommand.
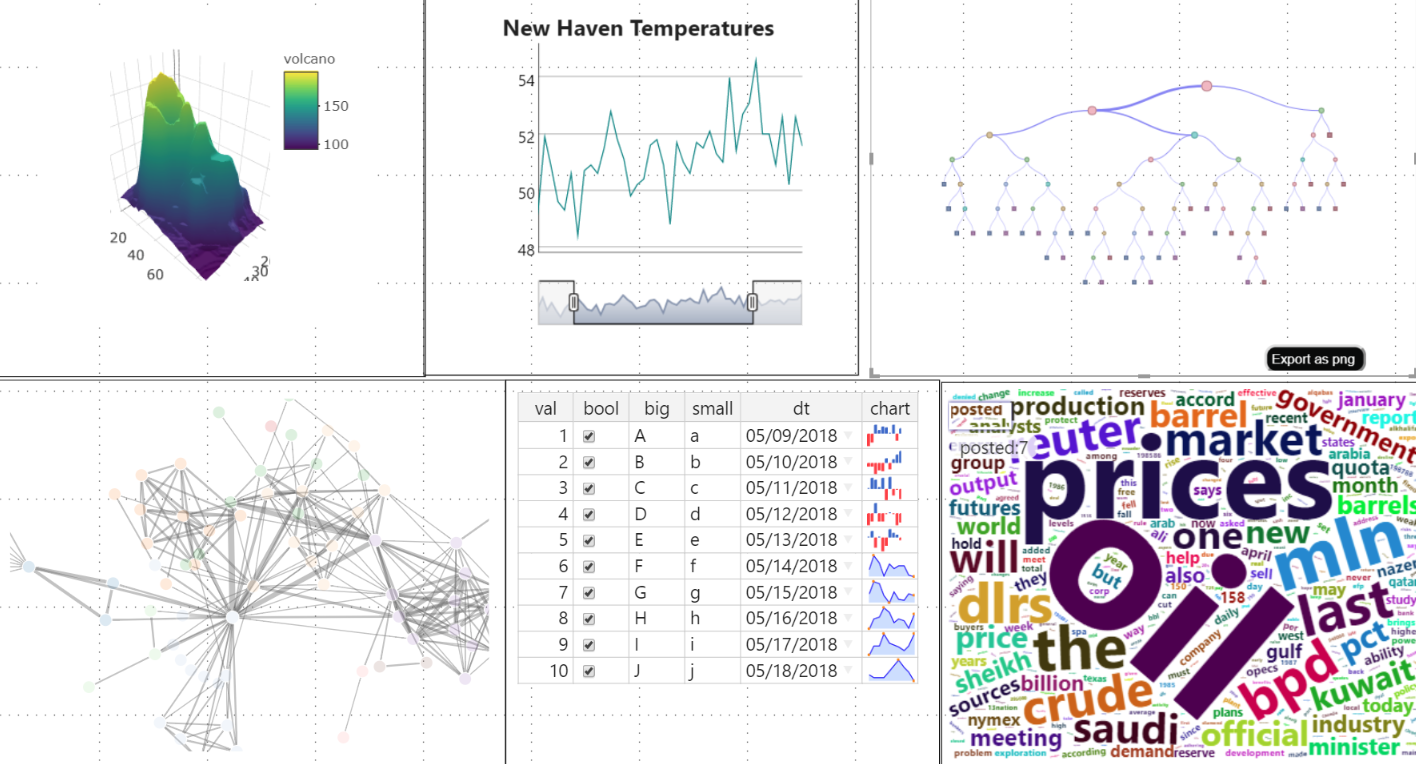
HTML widgets gallery
Explore visuals in the HTML widgets gallery for use in your next visual. To make things easy, we've created a visuals project repo with over 20 interactive HTML visuals to choose from!
Tip
To switch between html widgets use Format > Settings > Type. Try it out with this PBIX file.
To use a sample for your visual
- Download the entire folder.
- Edit script.r and dependencies.json to keep only one widget.
- Edit capabilities.json and settings.ts to remove the
Typeselector. - Change
const updateHTMLHead: boolean = true;tofalsein visual.ts. (for better performance) - Change metadata in pbiviz.json, most importantly the
guidfield. - Repackage and continue to customize the visual as wanted.

Note
Not all widgets in this project are supported by the service.
Related content
To learn more, see additional Power BI tutorials, Developing a Power BI circle card visual and R visuals.
Learn how to develop and submit visuals to the Office Store (gallery), or for further examples, see the R-script showcase