Note
Access to this page requires authorization. You can try signing in or changing directories.
Access to this page requires authorization. You can try changing directories.
The Windows high-contrast setting makes text and graphics easier to see by displaying more distinct colors. This article discusses how to add high-contrast mode support to Power BI visuals. For more information, see High-contrast support in Power BI.
To view an implementation of high-contrast support, go to the PowerBI-visuals-sampleBarChart visual repository.
To display a visual in high-contrast mode, you have to:
- Detect high-contrast mode and colors upon initialization.
- Draw the visual correctly on implementation.
Initialization
The colorPalette member of options.host has several properties for high-contrast mode. Use these properties to determine whether high-contrast mode is active and, if it is, what colors to use.
Detect that Power BI is in high-contrast mode
If
host.colorPalette.isHighContrastistrue, high-contrast mode is active, and the visual should draw itself accordingly.Get high-contrast colors
When displaying in high-contrast mode, your visual should limit itself to the following settings:
Foreground color is used to draw any lines, icons, text, and outline or fill of shapes.
Background color is used for background, and as the fill color of outlined shapes.
Foreground-selected color is used to indicate a selected or active element.
Hyperlink color is used only for hyperlink text.
Note
If a secondary color is needed, the foreground color can be used with some opacity (Power BI native visuals use 40% opacity). Use this sparingly to keep the visual details easy to see.
During initialization, you can store the following values in your constructor method:
private isHighContrast: boolean;

private foregroundColor: string;
private backgroundColor: string;
private foregroundSelectedColor: string;
private hyperlinkColor: string;
//...

constructor(options: VisualConstructorOptions) {
    this.host = options.host;
    let colorPalette: ISandboxExtendedColorPalette = host.colorPalette;
    //...
    this.isHighContrast = colorPalette.isHighContrast;
    if (this.isHighContrast) {
        this.foregroundColor = colorPalette.foreground.value;
        this.backgroundColor = colorPalette.background.value;
        this.foregroundSelectedColor = colorPalette.foregroundSelected.value;
        this.hyperlinkColor = colorPalette.hyperlink.value;
    }
Or, you can store the host object during initialization and access the relevant colorPalette properties during an update.
Implementation
The specific implementations of high-contrast support vary from visual to visual and depend on the details of the graphic design. To keep important details easy to distinguish with limited colors, high-contrast mode ordinarily requires a design that's slightly different from the default mode.
Power BI native visuals follow these guidelines:
- All data points use the same color (foreground).
- All text, axes, arrows, and lines use the foreground color.
- Thick shapes are drawn as outlines with thick strokes (at least two pixels) and background color fill.
- When data points are relevant, they're distinguished by different marker shapes, and data lines are distinguished by different dashing.
- When a data element is highlighted, all other elements change their opacity to 40%.
- For slicers and active filter elements, use the foreground-selected color.
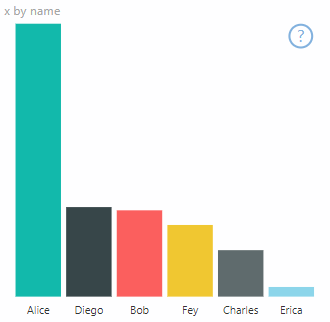
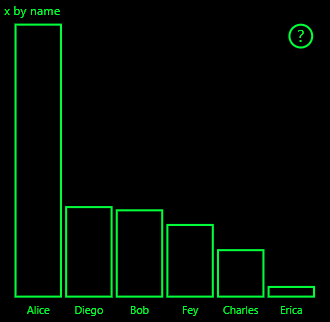
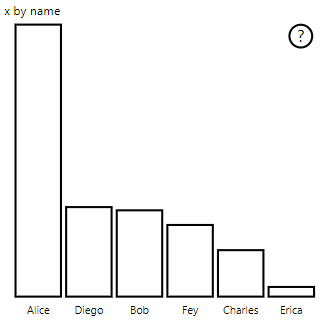
The following sample bar chart is drawn with two pixels of thick foreground outline and background fill. Compare the way it looks with default colors and with the following high-contrast themes:
Example
The following code shows one place in the visualTransform function that was changed to support high-contrast. It's called as part of rendering during the update. For the full implementation of this code, see the barChart.ts file in the PowerBI-visuals-sampleBarChart visual repository.
for (let i = 0, len = Math.max(category.values.length, dataValue.values.length); i < len; i++) {
    let defaultColor: Fill = {
        solid: {
            color: colorPalette.getColor(category.values[i] + '').value
        }
    };

    barChartDataPoints.push({
        category: category.values[i] + '',
        value: dataValue.values[i],
        color: getCategoricalObjectValue<Fill>(category, i, 'colorSelector', 'fill', defaultColor).solid.color,
        selectionId: host.createSelectionIdBuilder()
            .withCategory(category, i)
            .createSelectionId()
    });
}