Note
Access to this page requires authorization. You can try signing in or changing directories.
Access to this page requires authorization. You can try changing directories.
Power BI provides two ways to interact with visuals - selecting and filtering. The following example demonstrates how to select an item from one visual and notify the other visuals in the report about the new selection state.
The interface corresponds to a Selection object:
export interface ISelectionId {
    equals(other: ISelectionId): boolean;
    includes(other: ISelectionId, ignoreHighlight?: boolean): boolean;
    getKey(): string;
    getSelector(): Selector;
    getSelectorsByColumn(): SelectorsByColumn;
    hasIdentity(): boolean;
}
Use the selection manager to select data points
The visual host object provides a method for creating an instance of the selection manager. The selection manager has a corresponding method for each of the following actions:
- Select
- Clear the selection
- Show the context menu
- Store the current selections
- Check the selection state
Create an instance of the selection manager
To use the selection manager, create the instance of a selection manager. Usually, visuals create a selection manager instance in the constructor section of the visual object.
export class Visual implements IVisual {
    private target: HTMLElement;
    private host: IVisualHost;
    private selectionManager: ISelectionManager;
    // ...
    constructor(options: VisualConstructorOptions) {
        this.host = options.host;
        // ...
        this.selectionManager = this.host.createSelectionManager();
    }
    // ...
}
Create an instance of the selection builder
When the selection manager instance is created, you need to create selections for each data point of the visual. The visual host object's createSelectionIdBuilder method generates a selection for each data point. This method returns an instance of the object with interface powerbi.visuals.ISelectionIdBuilder:
export interface ISelectionIdBuilder {
    withCategory(categoryColumn: DataViewCategoryColumn, index: number): this;
    withSeries(seriesColumn: DataViewValueColumns, valueColumn: DataViewValueColumn | DataViewValueColumnGroup): this;
    withMeasure(measureId: string): this;
    withMatrixNode(matrixNode: DataViewMatrixNode, levels: DataViewHierarchyLevel[]): this;
    withTable(table: DataViewTable, rowIndex: number): this;
    createSelectionId(): ISelectionId;
}
This object has corresponding methods to create selections for different types of data view mappings.
Note
The methods withTable and withMatrixNode were introduced on API 2.5.0 of the Power BI visuals.
If you need to use selections for table or matrix data view mappings, update to API version 2.5.0 or higher.
Create selections for categorical data view mapping
Let's review how selections represent categorical data view mapping for a sample semantic model:
| Manufacturer | Type | Value |
|---|---|---|
| Chrysler | Domestic Car | 28883 |
| Chrysler | Domestic Truck | 117131 |
| Chrysler | Import Car | 0 |
| Chrysler | Import Truck | 6362 |
| Ford | Domestic Car | 50032 |
| Ford | Domestic Truck | 122446 |
| Ford | Import Car | 0 |
| Ford | Import Truck | 0 |
| GM | Domestic Car | 65426 |
| GM | Domestic Truck | 138122 |
| GM | Import Car | 197 |
| GM | Import Truck | 0 |
| Honda | Domestic Car | 51450 |
| Honda | Domestic Truck | 46115 |
| Honda | Import Car | 2932 |
| Honda | Import Truck | 0 |
| Nissan | Domestic Car | 51476 |
| Nissan | Domestic Truck | 47343 |
| Nissan | Import Car | 5485 |
| Nissan | Import Truck | 1430 |
| Toyota | Domestic Car | 55643 |
| Toyota | Domestic Truck | 61227 |
| Toyota | Import Car | 20799 |
| Toyota | Import Truck | 23614 |
The visual uses the following data view mapping:
{
    "dataRoles": [
        {
            "displayName": "Columns",
            "name": "columns",
            "kind": "Grouping"
        },
        {
            "displayName": "Rows",
            "name": "rows",
            "kind": "Grouping"
        },
        {
            "displayName": "Values",
            "name": "values",
            "kind": "Measure"
        }
    ],
    "dataViewMappings": [
        {
            "categorical": {
                "categories": {
                    "for": {
                        "in": "columns"
                    }
                },
                "values": {
                    "group": {
                        "by": "rows",
                        "select": [
                            {
                                "for": {
                                    "in": "values"
                                }
                            }
                        ]
                    }
                }
            }
        }
    ]
}
In the preceding example, Manufacturer is columns and Type is rows. A series is created by grouping values by rows (Type).
The visual should be able to slice data by Manufacturer or Type.
For example, if a user selects Chrysler by Manufacturer, other visuals should show the following data:
| Manufacturer | Type | Value |
|---|---|---|
| Chrysler | Domestic Car | 28883 |
| Chrysler | Domestic Truck | 117131 |
| Chrysler | Import Car | 0 |
| Chrysler | Import Truck | 6362 |
When the user selects Import Car by Type (selects data by series), the other visuals should show the following data:
| Manufacturer | Type | Value |
|---|---|---|
| Chrysler | Import Car | 0 |
| Ford | Import Car | 0 |
| GM | Import Car | 197 |
| Honda | Import Car | 2932 |
| Nissan | Import Car | 5485 |
| Toyota | Import Car | 20799 |
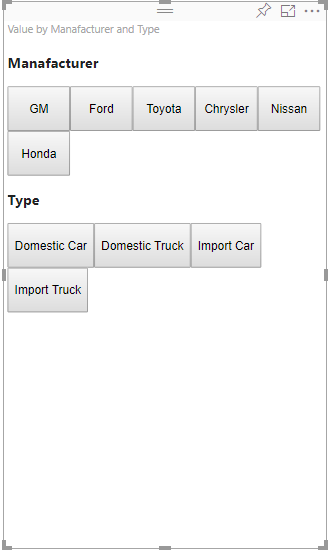
To display sliced data, fill the visual's data baskets as follows:
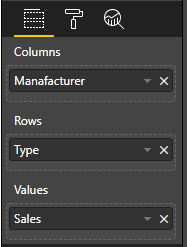
In the preceding example, Manufacturer is category (columns), Type is series (rows), and Sales is Values for series.
Note
Values are required for displaying a series because, according to the data view mapping, Values are grouped by Rows data.
Create selections for categories
// categories
const categories = dataView.categorical.categories;

// create label for 'Manufacturer' column
const p = document.createElement("p") as HTMLParagraphElement;
p.innerText = categories[0].source.displayName.toString();
this.target.appendChild(p);

// get count of category elements
const categoriesCount = categories[0].values.length;

// iterate all categories to generate selection and create button elements to use selections
for (let categoryIndex = 0; categoryIndex < categoriesCount; categoryIndex++) {
    const categoryValue: powerbi.PrimitiveValue = categories[0].values[categoryIndex];

    const categorySelectionId = this.host.createSelectionIdBuilder()
        .withCategory(categories[0], categoryIndex) // we have only one category (only one `Manufacturer` column)
        .createSelectionId();
    this.dataPoints.push({
        value: categoryValue,
        selection: categorySelectionId
    });
    console.log(categorySelectionId);

    // create button element to apply selection on click
    const button = document.createElement("button") as HTMLButtonElement;
    button.value = categoryValue.toString();
    button.innerText = categoryValue.toString();
    button.addEventListener("click", () => {
        // handle click event to apply correspond selection
        this.selectionManager.select(categorySelectionId);
    });
    this.target.appendChild(button);
}
In the preceding sample code, we iterate through all categories. In each iteration, we call createSelectionIdBuilder to create the next selection for each category by calling the withCategory method of the selection builder. The createSelectionId method is used as a final method to return the generated selection object.
In the withCategory method, we pass the column of category, in the sample, its Manufacturer, and the index of category element.
Create selections for series
// get groupped values for series
const series: powerbi.DataViewValueColumnGroup[] = dataView.categorical.values.grouped();

// create label for 'Type' column
const p2 = document.createElement("p") as HTMLParagraphElement;
p2.innerText = dataView.categorical.values.source.displayName;
this.target.appendChild(p2);

// iterate all series to generate selection and create button elements to use selections
series.forEach( (ser: powerbi.DataViewValueColumnGroup) => {
    // create selection id for series
    const seriesSelectionId = this.host.createSelectionIdBuilder()
        .withSeries(dataView.categorical.values, ser)
        .createSelectionId();

    this.dataPoints.push({
        value: ser.name,
        selection: seriesSelectionId
    });

    // create button element to apply selection on click
    const button = document.createElement("button") as HTMLButtonElement;
    button.value =ser.name.toString();
    button.innerText = ser.name.toString();
    button.addEventListener("click", () => {
        // handle click event to apply correspond selection
        this.selectionManager.select(seriesSelectionId);
    });
    this.target.appendChild(button);
});
Create selections for table data view mapping
The following example shows table data view mapping:
{
    "dataRoles": [
        {
            "displayName": "Values",
            "name": "values",
            "kind": "GroupingOrMeasure"
        }
    ],
    "dataViewMappings": [
        {
            "table": {
                "rows": {
                    "for": {
                        "in": "values"
                    }
                }
            }
        }
    ]
}
To create a selection for each row of table data view mapping, call the withTable method of selection builder.
public update(options: VisualUpdateOptions) {
    const dataView = options.dataViews[0];
    dataView.table.rows.forEach((row: DataViewTableRow, rowIndex: number) => {
        this.target.appendChild(rowDiv);
        const selection: ISelectionId = this.host.createSelectionIdBuilder()
            .withTable(dataView.table, rowIndex)
            .createSelectionId();
    }
}
The visual code iterates the rows of the table and each row calls the withTable table method. Parameters of the withTable method are the table object and the index of the table row.
Create selections for matrix data view mapping
public update(options: VisualUpdateOptions) {
    const host = this.host;
    const rowLevels: powerbi.DataViewHierarchyLevel[] = dataView.matrix.rows.levels;
    const columnLevels: powerbi.DataViewHierarchyLevel[] = dataView.matrix.rows.levels;

    // iterate rows hierarchy
    nodeWalker(dataView.matrix.rows.root, rowLevels);
    // iterate columns hierarchy
    nodeWalker(dataView.matrix.columns.root, columnLevels);

    function nodeWalker(node: powerbi.DataViewMatrixNode, levels: powerbi.DataViewHierarchyLevel[]) {
        const nodeSelection = host.createSelectionIdBuilder().withMatrixNode(node, levels);

        if (node.children && node.children.length) {
            node.children.forEach(child => {
                nodeWalker(child, levels);
            });
        }
    }
}
In the sample, nodeWalker recursively calls each node and child node.
nodeWalker creates a nodeSelection object on each call. Each nodeSelection represents a selection of corresponding nodes.
Select data points to slice other visuals
In this example, we created a click handler for button elements. The handler calls the select method of the selection manager and passes the selection object.
button.addEventListener("click", () => {
    // handle click event to apply correspond selection
    this.selectionManager.select(categorySelectionId);
});
The interface of the select method:
interface ISelectionManager {
    // ...
    select(selectionId: ISelectionId | ISelectionId[], multiSelect?: boolean): IPromise<ISelectionId[]>;
    // ...
}
The select method can accept an array of selections. This allows your visual to have several data points selected at once. The second parameter, multiSelect, is responsible for multi-selections. If multiSelect is true, Power BI doesn't clear the previous selection state when it applies the current selection. If the value is false, the previous selection is overwritten.
A typical example of using multiSelect is handling the Ctrl button state on a click event. When the Ctrl button is held down, you can select more than one object.
button.addEventListener("click", (mouseEvent) => {
    const multiSelect = (mouseEvent as MouseEvent).ctrlKey;
    this.selectionManager.select(seriesSelectionId, multiSelect);
});