Note
Access to this page requires authorization. You can try signing in or changing directories.
Access to this page requires authorization. You can try changing directories.
This article describes the basics of writing unit tests for your Power BI visuals, including how to:
- Set up the Karma JavaScript test runner testing framework, Jasmine.
- Use the powerbi-visuals-utils-testutils package.
- Use mocks and fakes to help simplify unit testing of Power BI visuals.
Prerequisites
- An installed Power BI visuals project
- A configured Node.js environment
The examples in this article use the bar chart visual for testing.
Install and configure the Karma JavaScript test runner and Jasmine
Add the required libraries to the package.json file in the devDependencies section:
"@types/jasmine": "^5.1.5",
"@types/karma": "^6.3.9",
"coverage-istanbul-loader": "^3.0.5",
"jasmine": "^5.5.0",
"karma": "^6.4.4",
"karma-chrome-launcher": "^3.2.0",
"karma-coverage": "^2.2.1",
"karma-coverage-istanbul-reporter": "^3.0.3",
"karma-jasmine": "^5.1.0",
"karma-junit-reporter": "^2.0.1",
"karma-sourcemap-loader": "^0.4.0",
"karma-typescript": "^5.5.4",
"karma-typescript-preprocessor": "^0.4.0",
"karma-webpack": "^5.0.1",
"playwright-chromium": "^1.49.0",
"powerbi-visuals-api": "~5.11.0",
"powerbi-visuals-tools": "^5.6.0",
"powerbi-visuals-utils-testutils": "6.1.1",
"powerbi-visuals-utils-typeutils": "6.0.3",
"style-loader": "^4.0.0",
"ts-loader": "~9.5.1"
To learn more about package.json, see the description at npm-package.json.
Save the package.json file and run the following command at the location of the package.json file:
npm install
The package manager installs all new packages that are added to package.json.
To run unit tests, configure the test runner and the webpack config.
The following code is a sample of the test.webpack.config.js file:
const path = require('path');
const webpack = require("webpack");

module.exports = {
    devtool: 'source-map',
    mode: 'development',
    module: {
        rules: [
            {
                test: /\.tsx?$/,
                use: 'ts-loader',
                exclude: /node_modules/
            },
            {
                test: /\.json$/,
                loader: 'json-loader'
            },
            {
                test: /\.tsx?$/i,
                enforce: 'post',
                include: path.resolve(__dirname, 'src'),
                exclude: /(node_modules|resources\/js\/vendor)/,
                loader: 'coverage-istanbul-loader',
                options: { esModules: true }
            },
            {
                test: /\.less$/,
                use: [
                    {
                        loader: 'style-loader'
                    },
                    {
                        loader: 'css-loader'
                    },
                    {
                        loader: 'less-loader',
                        options: {
                            lessOptions: {
                                paths: [path.resolve(__dirname, 'node_modules')]
                            }
                        }
                    }
                ]
            }
        ]
    },
    externals: {
        "powerbi-visuals-api": '{}'
    },
    resolve: {
        extensions: ['.tsx', '.ts', '.js', '.css']
    },
    output: {
        path: path.resolve(__dirname, ".tmp/test")
    },
    plugins: [
        new webpack.ProvidePlugin({
            'powerbi-visuals-api': null
        })
    ]
};
The following code is a sample of the test.tsconfig.json file:
{
  "compilerOptions": {
    "allowJs": false,
    "emitDecoratorMetadata": true,
    "experimentalDecorators": true,
    "target": "es2022",
    "sourceMap": true,
    "outDir": "./.tmp/build/",
    "sourceRoot": "../../src/",
    "moduleResolution": "node",
    "declaration": true,
    "lib": [
      "es2022",
      "dom"
  ]
  },
  "files": [
    "./test/visualTest.ts"
  ],
  "include": [
      "src/*.ts"
  ]
}
The following code is a sample of the karma.conf.ts file:
"use strict";

const webpackConfig = require("./test.webpack.config.js");
const tsconfig = require("./test.tsconfig.json");
const path = require("path");

const testRecursivePath = "test/visualTest.ts";
const srcOriginalRecursivePath = "src/**/*.ts";
const coverageFolder = "coverage";

process.env.CHROME_BIN = require("playwright-chromium").chromium.executablePath();

module.exports = (config) => {
    config.set({
        mode: "development",
        browserNoActivityTimeout: 100000,
        browsers: ["ChromeHeadless"], // or specify Chrome to use the locally installed Chrome browser
        colors: true,
        frameworks: ["jasmine", "webpack"],
        reporters: [
            "progress",
            "junit",
            "coverage",
            "coverage-istanbul"
        ],
        junitReporter: {
            outputDir: path.join(__dirname, coverageFolder),
            outputFile: "TESTS-report.xml",
            useBrowserName: false
        },
        singleRun: true,
        plugins: [
            "karma-coverage",
            "karma-typescript",
            "karma-webpack",
            "karma-jasmine",
            "karma-sourcemap-loader",
            "karma-chrome-launcher",
            "karma-junit-reporter",
            "karma-coverage-istanbul-reporter"
        ],
        files: [
            testRecursivePath,
            {
                pattern: srcOriginalRecursivePath,
                included: false,
                served: true
            },
            {
                pattern: './capabilities.json',
                watched: false,
                served: true,
                included: false
            }
        ],
        preprocessors: {
            [testRecursivePath]: ["webpack"]
        },
        typescriptPreprocessor: {
            options: tsconfig.compilerOptions
        },
        coverageIstanbulReporter: {
            reports: ["html", "lcovonly", "text-summary", "cobertura"],
            dir: path.join(__dirname, coverageFolder),
            'report-config': {
                html: {
                    subdir: 'html-report'
                }
            },
            combineBrowserReports: true,
            fixWebpackSourcePaths: true,
            verbose: false
        },
        coverageReporter: {
            type: "html",
            dir: path.join(__dirname, coverageFolder),
            reporters: [
                // reporters not supporting the `file` property
                { type: 'html', subdir: 'html-report' },
                { type: 'lcov', subdir: 'lcov' },
                // reporters supporting the `file` property, use `subdir` to directly
                // output them in the `dir` directory
                { type: 'cobertura', subdir: '.', file: 'cobertura-coverage.xml' },
                { type: 'lcovonly', subdir: '.', file: 'report-lcovonly.txt' },
                { type: 'text-summary', subdir: '.', file: 'text-summary.txt' },
            ]
        },
        mime: {
            "text/x-typescript": ["ts", "tsx"]
        },
        webpack: webpackConfig,
        webpackMiddleware: {
            stats: "errors-only"
        }
    });
};
If necessary, you can modify this configuration.
The code in karma.conf.js contains the following variables:
testRecursivePath: Locates the test code.srcOriginalRecursivePath: Locates the source code of your visual.coverageFolder: Determines where the coverage report is to be created.
The configuration file includes the following properties:
singleRun: true: Tests are run on a continuous integration (CI) system, or they can be run one time. You can change the setting tofalsefor debugging your tests. The Karma framework keeps the browser running so that you can use the console for debugging.files: [...]: In this array, you can specify the files to load to the browser. The files you load are typically source files, test cases, and libraries (such as Jasmine or test utilities). You can add more files as necessary.preprocessors: In this section, you configure actions that run before the unit tests run. The actions can precompile TypeScript to JavaScript, prepare source map files, and generate a code coverage report. You can disablecoveragewhen you debug your tests.coveragegenerates more code for code coverage testing, which complicates debugging tests.
For descriptions of all Karma configurations, go to the Karma Configuration File page.
For your convenience, you can add a test command into scripts in package.json:
{
    "scripts": {
        "pbiviz": "pbiviz",
        "start": "pbiviz start",
        "package": "pbiviz package",
        "pretest": "pbiviz package --resources --no-minify --no-pbiviz",
        "test": "karma start",
        "debug": "karma start --single-run=false --browsers=Chrome"
    }
    ...
}
You're now ready to begin writing your unit tests.
Check the DOM element of the visual
To test the visual, first create an instance of the visual.
Create a visual instance builder
Add a visualBuilder.ts file to the test folder by using the following code:
import { VisualBuilderBase } from "powerbi-visuals-utils-testutils";

import { BarChart as VisualClass } from "../src/barChart";

import powerbi from "powerbi-visuals-api";
import VisualConstructorOptions = powerbi.extensibility.visual.VisualConstructorOptions;

export class BarChartBuilder extends VisualBuilderBase<VisualClass> {
  constructor(width: number, height: number) {
    super(width, height);
  }

  protected build(options: VisualConstructorOptions) {
    return new VisualClass(options);
  }

  public get mainElement(): SVGElement | null {
    return this.element.querySelector("svg.barChart");
  }
}
The build method creates an instance of your visual. mainElement is a get method, which returns an instance of a root document object model (DOM) element in your visual. The getter is optional, but it makes writing the unit test easier.
You now have a build of an instance of your visual. Let's write the test case. The example test case checks the SVG elements that are created when your visual is displayed.
Create a TypeScript file to write test cases
Add a visualTest.ts file for the test cases by using the following code:
import powerbi from "powerbi-visuals-api";

import { BarChartBuilder } from "./visualBuilder";
import { SampleBarChartDataBuilder } from "./visualData";

import DataView = powerbi.DataView;

describe("BarChart", () => {
  let visualBuilder: BarChartBuilder;
  let dataView: DataView;
  let defaultDataViewBuilder: SampleBarChartDataBuilder;

  beforeEach(() => {
    visualBuilder = new BarChartBuilder(500, 500);
    defaultDataViewBuilder = new SampleBarChartDataBuilder();
    dataView = defaultDataViewBuilder.getDataView();
  });

  it("root DOM element is created", () => {
    visualBuilder.updateRenderTimeout(dataView, () => {
       expect(document.body.contains(visualBuilder.mainElement)).toBeTruthy();
    });
  });
});
Several Jasmine methods are called:
describe: Describes a test case. In the context of the Jasmine framework,describeoften describes a suite or group of specs.beforeEach: Is called before each call of theitmethod, which is defined in thedescribemethod.it: Defines a single spec. Theitmethod should contain one or moreexpectations.expect: Creates an expectation for a spec. A spec succeeds if all expectations pass without any failures.toBeInDOM: Is one of the matchers methods. For more information about matchers, see Jasmine Namespace: matchers.
For more information about Jasmine, see the Jasmine framework documentation page.
How to add static data for unit tests
Create the visualData.ts file in the test folder by using the following code:
import powerbi from "powerbi-visuals-api";
import DataView = powerbi.DataView;

import { testDataViewBuilder } from "powerbi-visuals-utils-testutils";

import TestDataViewBuilder = testDataViewBuilder.TestDataViewBuilder;

export class SampleBarChartDataBuilder extends TestDataViewBuilder {
  public static CategoryColumn: string = "category";
  public static MeasureColumn: string = "measure";

  public getDataView(columnNames?: string[]): DataView {
    let dataView: any = this.createCategoricalDataViewBuilder(
      [
          ...
      ],
      [
          ...
      ],
      columnNames
    ).build();

    // there's client side computed maxValue
    let maxLocal = 0;
    this.valuesMeasure.forEach((item) => {
      if (item > maxLocal) {
        maxLocal = item;
      }
    });
    (<any>dataView).categorical.values[0].maxLocal = maxLocal;

    return dataView;
  }
}
The SampleBarChartDataBuilder class extends TestDataViewBuilder and implements the abstract method getDataView.
When you put data into data-field buckets, Power BI produces a categorical dataview object based on your data.
In unit tests, you don't have access to Power BI core functions that you normally use to reproduce the data. But you need to map your static data to the categorical dataview. Use the TestDataViewBuilder class to map your static data.
For more information about Data View mapping, see DataViewMappings.
In the getDataView method, you call the createCategoricalDataViewBuilder method with your data.
In the sampleBarChart visual capabilities.json file, we have dataRoles and dataViewMapping objects:
"dataRoles": [
    {
        "displayName": "Category Data",
        "name": "category",
        "kind": "Grouping"
    },
    {
        "displayName": "Measure Data",
        "name": "measure",
        "kind": "Measure"
    },
    {
      "displayName": "Tooltips",
      "name": "Tooltips",
      "kind": "Measure"
    }
],
"dataViewMappings": [
    {
        "conditions": [
            {
                "category": {
                    "max": 1
                },
                "measure": {
                    "max": 1
                }
            }
        ],
        "categorical": {
            "categories": {
                "for": {
                    "in": "category"
                }
            },
            "values": {
                "select": [
                    {
                        "bind": {
                            "to": "measure"
                        }
                    }
                ]
            }
        }
    }
],
To generate the same mapping, you must set the following parameters to the createCategoricalDataViewBuilder method:
([
    {
        source: {
            displayName: "Category",
            queryName: SampleBarChartDataBuilder.CategoryColumn,
            type: ValueType.fromDescriptor({ text: true }),
            roles: {
                Category: true
            },
        },
        values: this.valuesCategory
    }
],
[
    {
        source: {
            displayName: "Measure",
            isMeasure: true,
            queryName: SampleBarChartDataBuilder.MeasureColumn,
            type: ValueType.fromDescriptor({ numeric: true }),
            roles: {
                Measure: true
            },
        },
        values: this.valuesMeasure
    },
], columnNames)
Where this.valuesCategory is an array of categories:
public valuesCategory: string[] = ["Monday", "Tuesday", "Wednesday", "Thursday", "Friday", "Saturday", "Sunday"];
And this.valuesMeasure is an array of measures for each category:
public valuesMeasure: number[] = [742731.43, 162066.43, 283085.78, 300263.49, 376074.57, 814724.34, 570921.34];
The final version of visualData.ts contains the following code:
import powerbi from "powerbi-visuals-api";
import DataView = powerbi.DataView;

import { testDataViewBuilder } from "powerbi-visuals-utils-testutils";
import { valueType } from "powerbi-visuals-utils-typeutils";
import ValueType = valueType.ValueType;

import TestDataViewBuilder = testDataViewBuilder.TestDataViewBuilder;

export class SampleBarChartDataBuilder extends TestDataViewBuilder {
  public static CategoryColumn: string = "category";
  public static MeasureColumn: string = "measure";
  public valuesCategory: string[] = [
    "Monday",
    "Tuesday",
    "Wednesday",
    "Thursday",
    "Friday",
    "Saturday",
    "Sunday",
  ];
  public valuesMeasure: number[] = [
    742731.43, 162066.43, 283085.78, 300263.49, 376074.57, 814724.34, 570921.34,
  ];

  public getDataView(columnNames?: string[]): DataView {
    let dataView: any = this.createCategoricalDataViewBuilder(
      [
        {
          source: {
            displayName: "Category",
            queryName: SampleBarChartDataBuilder.CategoryColumn,
            type: ValueType.fromDescriptor({ text: true }),
            roles: {
              category: true,
            },
          },
          values: this.valuesCategory,
        },
      ],
      [
        {
          source: {
            displayName: "Measure",
            isMeasure: true,
            queryName: SampleBarChartDataBuilder.MeasureColumn,
            type: ValueType.fromDescriptor({ numeric: true }),
            roles: {
              measure: true,
            },
          },
          values: this.valuesMeasure,
        },
      ],
      columnNames
    ).build();

    // there's client side computed maxValue
    let maxLocal = 0;
    this.valuesMeasure.forEach((item) => {
      if (item > maxLocal) {
        maxLocal = item;
      }
    });
    (<any>dataView).categorical.values[0].maxLocal = maxLocal;

    return dataView;
  }
}
The ValueType class is defined in the powerbi-visuals-utils-typeutils package.
Now, you can run the unit test.
Launch unit tests
This test checks that the root SVG element for your visual exists when the visual runs. To run the unit test, enter the following command in the command-line tool:
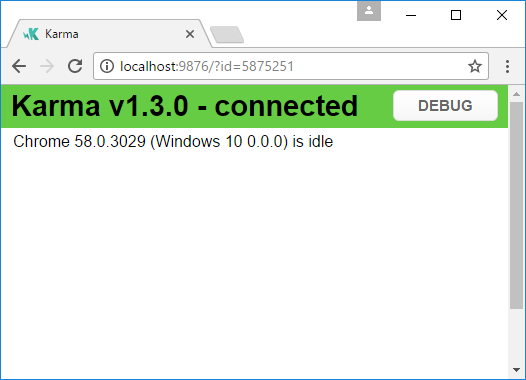
npm run test
karma.js runs the test case in the Chrome browser.
Note
You must install Google Chrome locally.
In the command-line window, you get following output:
> karma start

Webpack bundling...
assets by status 8.31 KiB [compared for emit]
  assets by path ../build/test/*.ts 1020 bytes
    asset ../build/test/visualData.d.ts 512 bytes [compared for emit]
    asset ../build/test/visualBuilder.d.ts 499 bytes [compared for emit]
    asset ../build/test/visualTest.d.ts 11 bytes [compared for emit]
  assets by path ../build/src/*.ts 6.67 KiB
    asset ../build/src/barChart.d.ts 4.49 KiB [compared for emit]
    asset ../build/src/barChartSettingsModel.d.ts 2.18 KiB [compared for emit]
  asset visualTest.3941401795.js 662 bytes [compared for emit] (name: visualTest.3941401795) 1 related asset
assets by status 2.48 MiB [emitted]
  asset commons.js 2.48 MiB [emitted] (name: commons) (id hint: commons) 1 related asset
  asset runtime.js 6.48 KiB [emitted] (name: runtime) 1 related asset
Entrypoint visualTest.3941401795 2.48 MiB (2.34 MiB) = runtime.js 6.48 KiB commons.js 2.48 MiB visualTest.3941401795.js 662 bytes 3 auxiliary assets
webpack 5.97.0 compiled successfully in 3847 ms
04 12 2024 11:01:19.255:INFO [karma-server]: Karma v6.4.4 server started at http://localhost:9876/
04 12 2024 11:01:19.257:INFO [launcher]: Launching browsers ChromeHeadless with concurrency unlimited
04 12 2024 11:01:19.277:INFO [launcher]: Starting browser ChromeHeadless
04 12 2024 11:01:20.634:INFO [Chrome Headless 131.0.0.0 (Windows 10)]: Connected on socket QYSj9NyHQ14QjFBoAAAB with id 9616879
Chrome Headless 131.0.0.0 (Windows 10): Executed 1 of 1 SUCCESS (0.016 secs / 0.025 secs)
TOTAL: 1 SUCCESS
TOTAL: 1 SUCCESS

=============================== Coverage summary ===============================
Statements   : 66.07% ( 187/283 )
Branches     : 34.88% ( 45/129 )
Functions    : 52.85% ( 37/70 )
Lines        : 65.83% ( 185/281 )
================================================================================
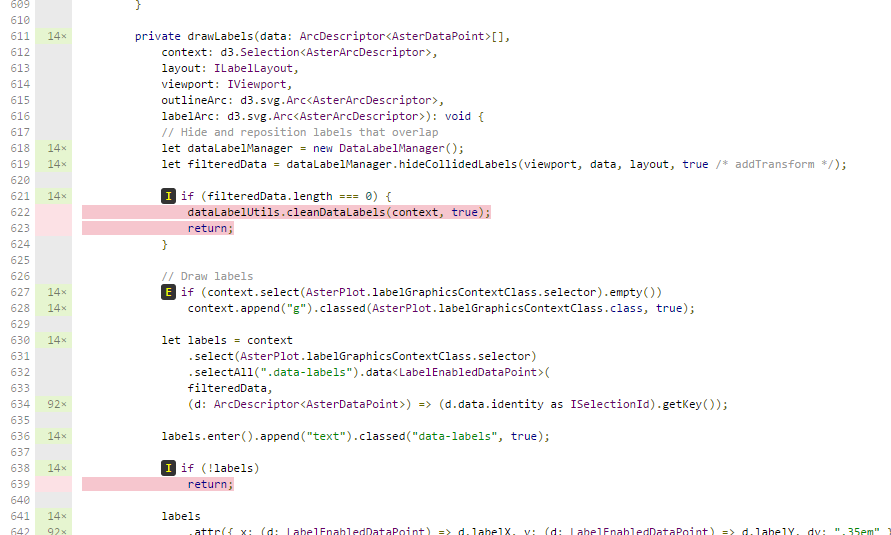
To learn more about current code coverage, open the coverage/html-report/index.html file.
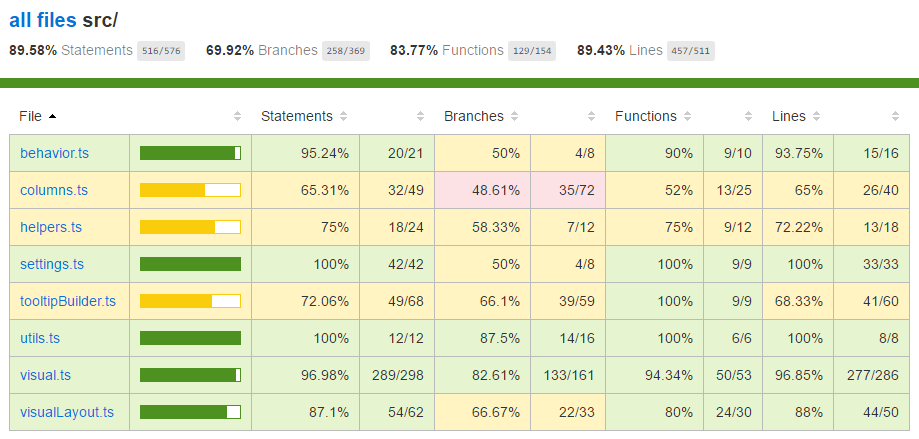
In the file scope, you can view the source code. The coverage utilities highlight the row in red if certain lines of code don't run during the unit tests.
Important
Code coverage doesn't mean that you have good functionality coverage of the visual. One simple unit test provides over 96 percent coverage in src/barChart.ts.
Debugging
To debug your tests via browser console, change the singleRun value in karma.conf.ts to false. This setting will keep your browser running when the browser launches after the tests run.
Your visual opens in the Chrome browser.

Related content
When your visual is ready, you can submit it for publication. For more information, see Publish Power BI visuals to AppSource.