Power BI Desktop diagnostics collection
To provide better supportability and diagnostics, Power BI Desktop can collect and submit diagnostic information. The process of collecting and sending Power BI diagnostic information is simple and easy to use. You should only save diagnostic details when instructed to do so by Microsoft Support.
How to save diagnostics details in Power BI Desktop
To save diagnostic information in Power BI Desktop:
In Power BI Desktop, select File > Options and settings > Options.
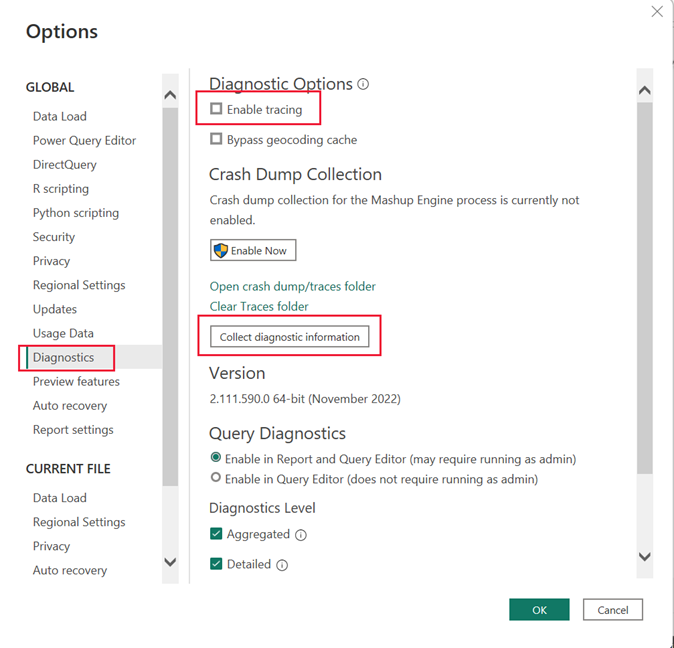
Under Global, select Diagnostics.
Select Enable tracing.
Select Collect diagnostic information.
After you select Collect diagnostic information, the Save diagnostics details dialog appears:
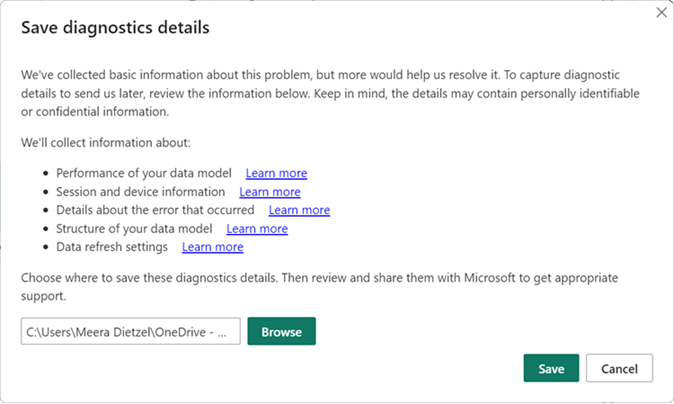
Review the information provided in the dialog. To learn more about the information collected, see the Diagnostic information collected section in this article.
By default, the diagnostic details are saved in your Documents folder. Select Browse to navigate to and select another location.
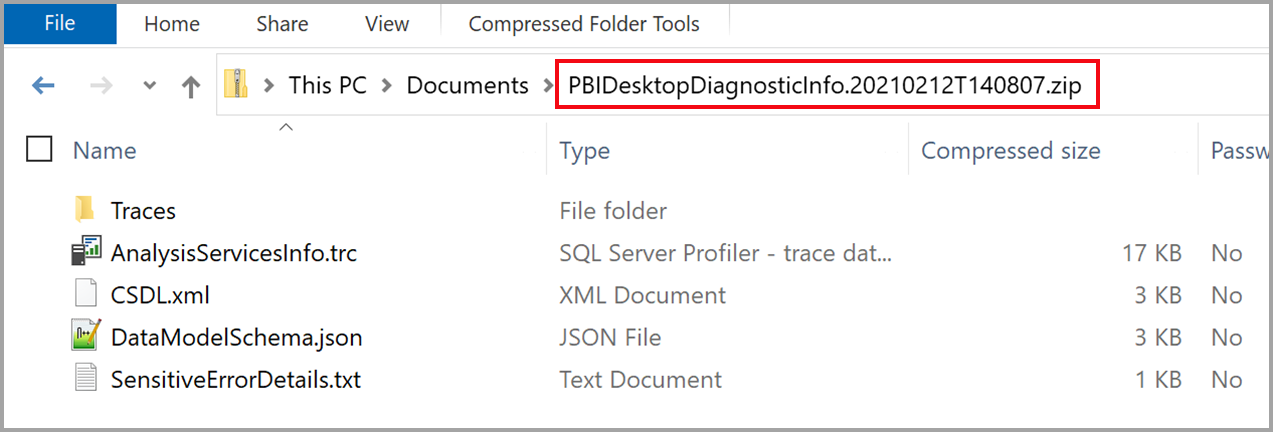
After you select a new location for Power BI Desktop to save the diagnostic information, select Save. The Save diagnostics details dialog opens. Select Open to view your diagnostic information in a compressed folder named PBIDesktopDiagnosticInfo.[timestamp].zip in the location you specified.
The diagnostics ZIP file might contain the following files and directories, based on what happened on your computer and your settings:
- ErrorsInfo.yaml - Contains details about any errors that occurred and gets created only if an error dialog was shown.
- PackagingErrorsInfo.yaml - Contains information about any errors that occurred during detail collection.
- AnalysisServicesInfo.trc - Contains information about the performance of your data model.
- SessionDeviceInfo.txt - Contains session and device information.
- AutoPageRefresh.json - Contains the data refresh settings.
- CSDL.xml - Describes the structure of the data model.
- DatabaseSchema.json - Describes the structure of the data model.
- DataModelSchema.json - Describes the structure of the data model.
- Traces folder and files - Contains detailed session and device information.
- QueryEvaluations.json - Contains evaluation results when loading or refreshing a query.
- RemoteCsdls.json - Describes the structure of the remote data models
If requested by Microsoft support, send the ZIP file containing the diagnostic details.
The following video shows the diagnostics collection process:
Collecting mashup traces
The steps in the previous section do not include collection of mashup traces. To include mashup traces in your diagnostic collections, follow these steps:
- Navigate to
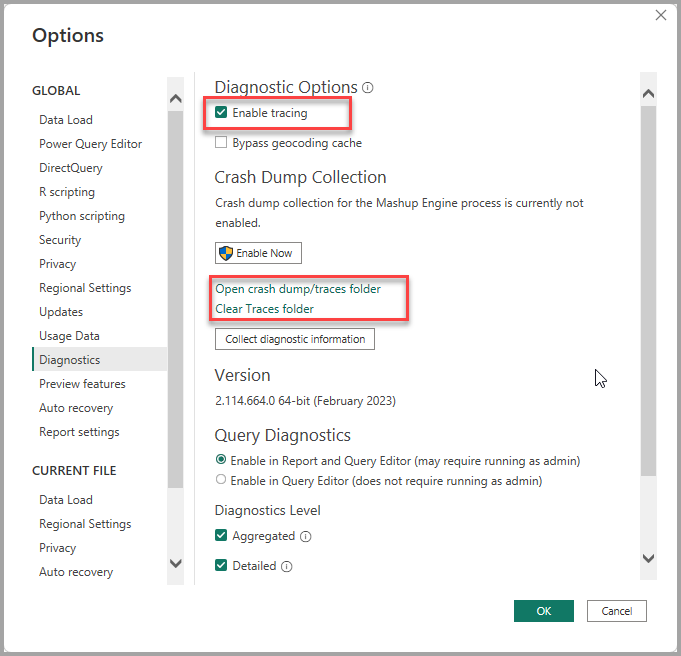
%localappdata%\Microsoft\Power BI Desktop\Tracesand clear the contents of that folder. If you need data from that folder for future reference, you can archive it before emptying the folder. If you're using the Microsoft Store version of Power BI Desktop, the path to traces is%userprofile%\Microsoft\Power BI Desktop Store App\Traces. To determine which folder is used for crash dumps, you can select the Open crash dump/traces folder link in the Diagnostics window shown in the following step. - Ensure Enable tracing is enabled in Power BI Desktop, by navigating to File > Options and settings > Options then selecting Diagnostics from the sections in the left pane. Ensure Enable tracing is checked, as shown in the following image.
- Reproduce the issue or situation for which you want to collect diagnostics and mashup traces.
- Close Power BI Desktop to ensure all traces are flushed to the disk.
- Open
%localappdata%\Microsoft\Power BI Desktop\Traces(or%userprofile%\Microsoft\Power BI Desktop Store App\Tracesif you're using the Microsoft Store version of Power BI Desktop) and compress the contents into a ZIP or similar compressed file. - Repeat this series of steps for any additional scenarios you want to capture.
Diagnostic information collected
The diagnostic information collected is comprehensive and includes information most commonly required to solve issues. Power BI Desktop collects information about:
- The performance of your data model.
- The current Power BI Desktop session and your device.
- The issue that occurred.
- The structure of your data model.
- Data refresh settings.
The following sections provide more details about the information collected.
Performance of your data model
The data model performance information helps you analyze the interaction between the Power BI engine and data sources. It's especially relevant in situations where you're experiencing:
- Issues with model performance.
- DirectQuery issues.
- Aggregation issues.
The following information is included:
- The locale of your Power BI Desktop environment
- The Power BI Desktop version
- The path where the currently open .pbix file and data model are stored on your computer
- Whether your data model is in import, DirectQuery, or a mixed mode
- Any queries created to generate visuals, including table, column, measure names, and data values if used as a filter
Session and device information
The session and device information provides insight into the complexity of the queries and features used. It includes information about:
- The operating system, including the version, time zone configuration.
- Hardware, including the memory configuration.
- The Power BI Desktop version.
- The Power BI Desktop configuration, such as whether fast combine is enabled.
- The path to where the trace logs are stored on your local computer.
- The data model default mode (import, DirectQuery, or a mixed mode).
- The data model metadata version.
- The preview features enabled or disabled.
- Any DirectQuery option settings.
- The name of the cloud environment (tenant) where you're signed in (if any).
- Power Query queries.
Session and device information is especially relevant if you're experiencing:
- Issues with report and Power Query performance.
- Issues where Power BI Desktop stops responding, stops unexpectedly, or doesn't load properly.
Details about the error that occurred
Error information includes exactly which error occurred and where it happened. It also includes a link to where the trace logs are stored on your local computer. It also includes:
- The data model default mode (import, DirectQuery, or a mixed mode).
- The data model metadata version.
- Preview features enabled or disabled in Power BI Desktop.
- The name of the cloud environment (tenant) you're signed into (if any).
- The recent actions you performed, such as adding a field to a visual.
- Power Query queries.
Error information is especially relevant if you're experiencing:
- Issues with report and Power Query performance.
- Issues where Power BI Desktop stops responding, stops unexpectedly, or doesn't load properly.
Structure of your data model
The information collected is a text description of everything you can see in the data model view in Power BI Desktop, including:
- Table information, including the name and number of rows
- Column information, including the name, data types, number of distinct values, and minimum and maximum values.
- Relationships, including to/from which table and column, direction, cardinality, and other settings.
- Calculated columns definitions.
- Measure definitions.
- Role definitions.
- Remote source structure and query.
Data model structure information is especially relevant if you're experiencing:
- Issues with model performance.
- Issues with modeling in general.
Data refresh settings
Data refresh information helps you analyze issues with incremental refresh, aggregations, and automatic page refresh. It describes the incremental refresh settings made (including table names), any aggregations defined (including table and column names).
Data refresh information is especially relevant if you're experiencing:
- Issues with incremental and automatic page refresh.
- Issues with aggregations, including performance issues.
Related content
You can do all sorts of things with Power BI Desktop. For more information about its capabilities, check out the following resources: