Use accessibility tools to create accessible paginated reports (Power BI Report Builder)
APPLIES TO: ![]() Power BI Report Builder
Power BI Report Builder ![]() Power BI Desktop
Power BI Desktop
Power BI Report Builder has an inclusive design, which makes it accessible to people with disabilities as well as people without disabilities. Individuals who have physical disabilities, low-vision or temporal disabilities can also use Power BI Report Builder to create paginated reports.
This article describes the types of accessibility tools available for report creators for creating paginated reports.
Accessibility tools for creating paginated reports
The accessibility tools that are compatible with Power BI Report Builder and can be used by report creators to create accessible paginated reports include the following:
- Screen reader
- Keyboard navigation
In the following sections we would look at these tools in detail.
Screen reader
Power BI Report Builder is screen reader compatible; report creators with low or no vision can use it for creating paginated reports. As the report creator navigates the various levels of the app, the screen reader reads out the object in focus. A screen-reader can also help in navigating the dialogs in Power BI Report Builder. When a dialog box is displayed, the screen reader reads aloud the menu context as the user navigates it.
Note
Use the wizards to create tables or chart elements while using a screen reader to create your report. The screen reader will be able to read out all the items, making the process easier and less confusing than when creating them from scratch.
Keyboard navigation
As a report creator, you can use the keyboard to navigate and create a paginated report in Power BI Report Builder. This section describes how to navigate the various levels of the app while creating your report.
App-level navigation
When navigating in Power BI Report Builder, you can move focus to the main areas of the app by pressing F6 or Shift + F6. Shifting focus in the main area of Power BI Report Builder progresses in the following order:
- The ribbon
- Data pane
- Report design surface
- Grouping pane
- Properties pane
Ribbon navigation
To navigate the Ribbon, press the Alt key and you’ll see little boxes called KeyTips appear over each command available in the current view of the ribbon. Then you can press the letter shown in the KeyTip that hovers over the command you want to use.
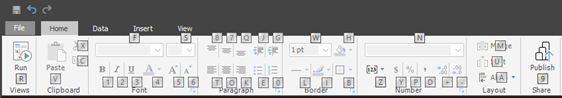
In the following image, the Alt key was pressed to display the KeyTips that contains the letters for accessible commands. Pressing I opens the Insert tab on the ribbon.
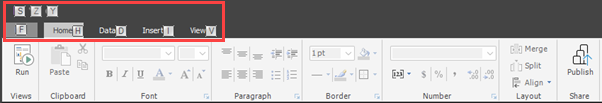
Depending on which letter you press, you will see other KeyTips for other functions under the tab selected. For example, if you press H, the Home tab is displayed along with the KeyTips for the groups in that Home ribbon tab as shown in the following image. You can then press the letters or numbers displayed in KeyTips for the specific command you want to use.
To move to the previous set of KeyTips, press Esc. To cancel the action you’re taking and hide the KeyTips, press the Alt key.
Report Data pane navigation
If the Report Data pane is not visible, you can make it visible by pressing Alt + V + D. To navigate the Report Data pane, make sure your focus is on the pane by pressing F6 until you reach that pane. When you navigate to the Report Data pane, the focus first lands on the toolbar of the pane. To switch between the toolbar options, use Left and Right arrow keys.
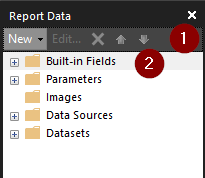
You can move focus from the Report Data pane toolbar to the first item in Report Data pane Built-in Fields by using the Tab key as seen in the image above. When the focus is on the first item on the Report Data pane, you can then use Up and Down arrow keys to navigate to a particular item on the Report Data pane. To Expand any item, use Right arrow key, while the Left arrow key can be used to collapse any item. A screen reader reads out the items as you move across them stating if it is collapsed or expanded.
Properties pane navigation
If the Properties Pane is not visible, you can make it visible by pressing Alt + V + P. To navigate the Properties pane, make sure your focus is on the pane by pressing F6 until you reach that pane. When you navigate to the Properties pane, the focus first lands on the toolbar of that pane. To switch to other toolbar options, use Left and Right arrow keys, a screen reader reads out the options as you move across them.
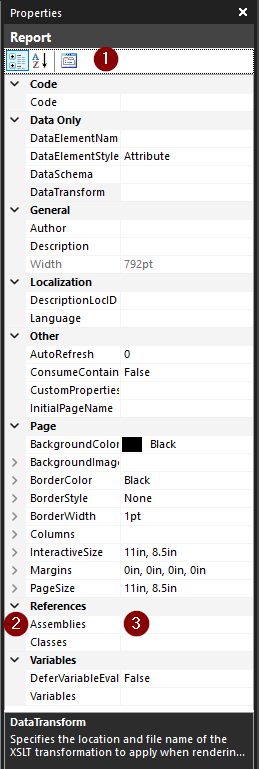
The tab order starts from the top in the following order:
- Properties pane toolbar
- Property name
- The value of the property selected.
Use the Tab key to move focus from the toolbar to Properties categories, then you can use the Up and Down arrow keys to navigate to a particular property. The Tab key can be used to move focus from a property name to its value. To Expand any property, use the Right arrow key while the Left arrow key can be used to collapse any property. A screen reader reads out the property you have selected and whether it is collapsed or expanded. For property value with a drop-down selection option, simply move the focus to the dropdown with the Tab key and then click on the Space bar and the dropdown options will be displayed.
Grouping pane navigation
If the Grouping pane is not visible, then you can make it visible by pressing Alt + V + G. To navigate to the Grouping pane, make sure your focus is on the pane by pressing F6 until you reach that pane. When you navigate to the Grouping pane, the focus first lands on the first group in the Row Groups Section. The tab order moves from the top and is shown in the following image:
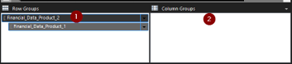
- The first Row Group
- The first Column Group
When focus is on the Row Groups or Column Groups, tabbing lands only on the first group. To switch to other groups, use Up and Down arrow keys. You can edit the group properties by opening a context menu for each group by using Space bar or Right arrow key as shown in the following image. You can navigate through the available options by using the Up and Down arrow keys. Use the Right arrow key to expand the options and the Left arrow key to move back to the main set of options. To cancel the action, use the Esc key.
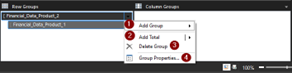
- Add Group
- Add Total
- Delete Group
- Group Properties
Report Design Surface navigation
To navigate between objects on the Report design pane, make sure your focus is on the Report design pane by pressing F6 until you reach that pane. Use the Tab key to move between report objects, the arrow keys to move selected objects and Ctrl + Shift + arrow keys to move a selected object in small increments. To increase or decrease the size of a report object, move focus to the object and press Shift + arrow keys. You can zoom in on the report body by pressing the Ctrl and + keys, to zoom out simply press Ctrl and – keys.
Note
When navigating Power BI Report Builder, the Enter key is commonly used to select or enter an area, and Esc to exit. For the detailed list of keyboard shortcuts, see Keyboard shortcuts for accessibility in paginated reports in Report Builder.
Power BI Report Builder dialog boxes
All dialogs in Power BI Report Builder are accessible through keyboard navigation and work with screen readers. Dialogs in Power BI Report Builder include:
- Data source properties dialog
- Data set properties dialog
- Report parameters properties dialog
- Visual wizard dialog
- Visual properties dialog
- File menu
- Property pages
This section describes how to navigate through some dialogs in Power BI Report Builder.
Add data sources
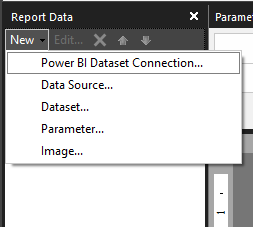
To add the data sources, make sure your focus is on the Report Data pane by pressing F6 until you reach that pane. When focus is on the New option in the toolbar, use Space bar or Enter or Down arrow key to expand the sub-menu for the New option and select Data Source as shown in the following image:
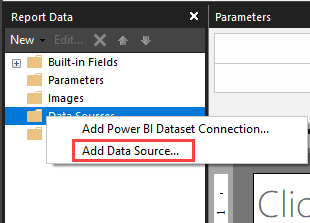
Another option is to press Shift + F10 key while focus is on the Data Sources folder on the Report Data pane, this opens a context menu where you can navigate through the options by using Up and Down arrow keys.
To add the data source, make sure focus is on the appropriate data source option and then press Enter. It will open a dialog box depending on the data source option you choose. The tab order is shown in the following images:
A. When you choose Data Source option
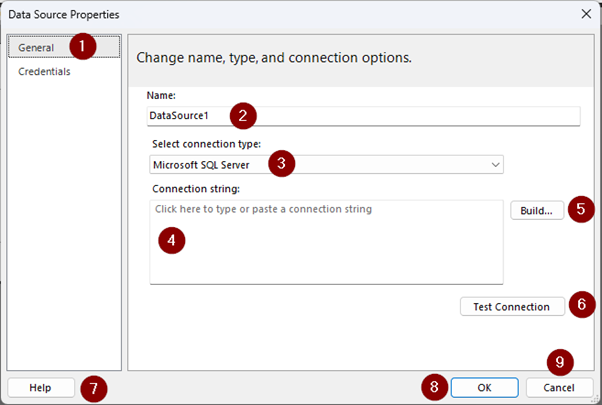
- Data Source Properties Navigation Side Bar List
- Data Source Name
- Data Source Type
- Data Source Connection Details
- Build Button (This depends on the data source type selected)
- Test Connection Button
- Help Button
- Ok Button
- Cancel Button
When focus is on the Data Source Properties Navigation Side Bar List, you can switch between the options displayed with the Up and Down arrow keys, a screen reader reads out the names as you move across the list.
B. When you choose Power BI Semantic Model Connection
- Dialog box header
- Dialog box description
- List of workspaces available
- Search option
- The first dataset in the selected workspace
- Name of the dataset selected
- Select button
- Cancel button
When focus is on the Dataset or the workspace list, you can switch between the options with the Up and Down arrow keys, a screen reader reads out the names as you move across the list.
Add datasets
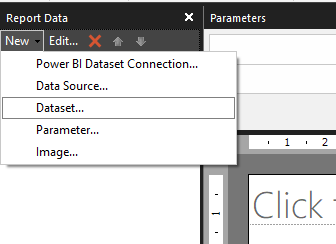
To add the Data Datasets, make sure your focus is on the Report Data pane by pressing F6 until you reach that pane. When focus is on the New option in the toolbar, use Space bar or Enter or Down arrow keys to expand the sub-menu for the New option and tab through the options and press Enter on Dataset as shown in the following image:
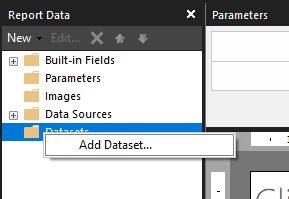
Another option is to press Shift + F10 key while focus is on the Datasets folder on the Report Data. Use the Tab key to move focus to the Add Dataset option and then press Enter to select it as shown in the following image:
This opens the Dataset Properties dialog box. The tab order for the Dataset Properties dialog box is shown here:
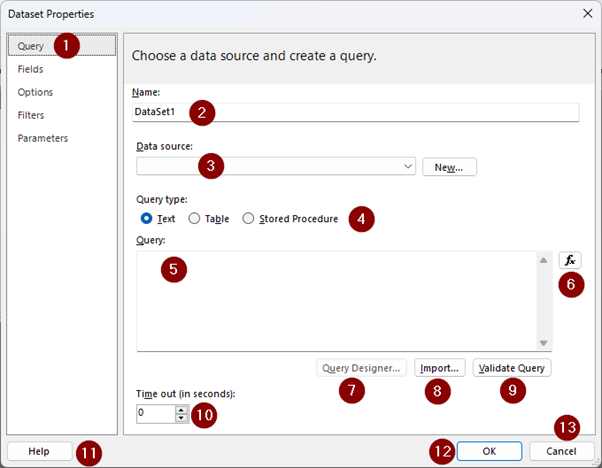
- Dataset Properties Navigation Side Bar List
- Dataset Name
- Data source drop-down
- Query type
- Query
- Query expression
- Query designer button
- Import button
- Validate Query button
- Time out
- Help button
- Ok button
- Cancel button
When focus is on the Dataset Properties Navigation Side Bar, you can move through the list with the Up and Down arrow keys, a screen reader reads out the names as you move across the list.
Add Report Parameters
To add the Parameters, make sure your focus is on the Report Data pane by pressing F6 until you reach that pane. When focus is on the New option in the toolbar, use Space bar or Enter or Down arrow keys to expand the sub-menu for the New option. Tab to the Parameter option and press Enter.
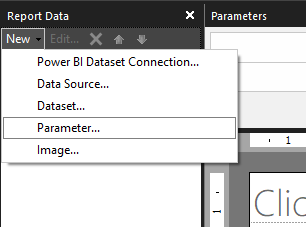
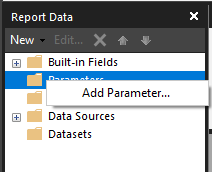
Another option is to press Shift + F10 key on the Parameters folder on the Report Data pane and then tab to the Add Parameter option and press Enter.
This opens the Report Parameter Properties dialog box. The tab order for the Report Parameter Properties dialog box is shown in the following image:
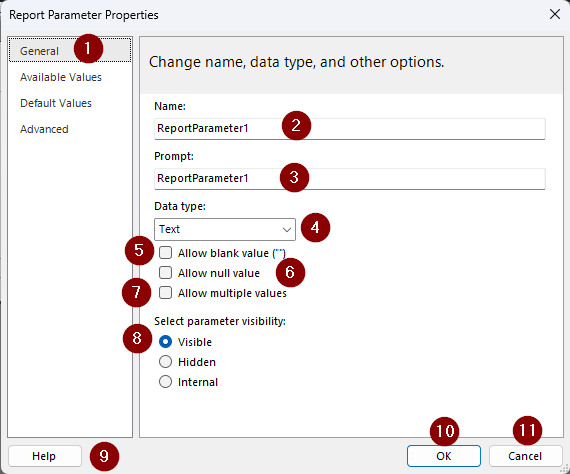
- Report Parameter Properties Navigation Side Bar List
- Parameter Name
- Parameter Prompt
- Data type
- Allow blank value
- Allow null value
- Allow multiple values
- Parameter visibility options
- Help button
- Ok button
- Cancel button
When focus is on the Report Parameter Properties Navigation Side Bar List, you can move through the list with the Up and Down arrow keys, a screen reader reads out the names as you move across the list.
Note
To show the Parameters pane, press Alt + V to open the View tab on the Ribbon. Then use the Tab key to navigate to Parameters and click on the Space bar key to tick the box for parameter.
Add a table by using the Table Wizard
To add a table in the report body, use Alt + I + A. This opens a context menu for the available options for adding a table. The tab order is shown in the following image:
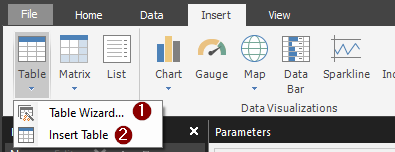
Use the Up and Down arrow keys to move between both options and choose the Table Wizard option by pressing Enter when the focus is on the Table Wizard. It opens the New Table or Matrix dialog. The tab order for the dialog is shown in the following image:
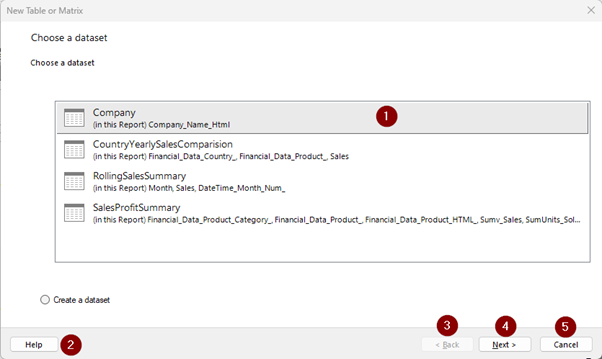
- Dataset list
- Help button
- Back button
- Next button
- Cancel button
When focus is on the first dataset in list, you can move through the list of the available dataset, with the Up and Down arrow keys. A screen reader reads out the dataset name as you move through the list. To select a dataset, press the Enter key when focus is on your choice. This opens a new context menu for adding the fields of the selected dataset to the appropriate table groups such as the Row Groups, Column Groups or Values segment of the table. The tab order is shown in the following image:
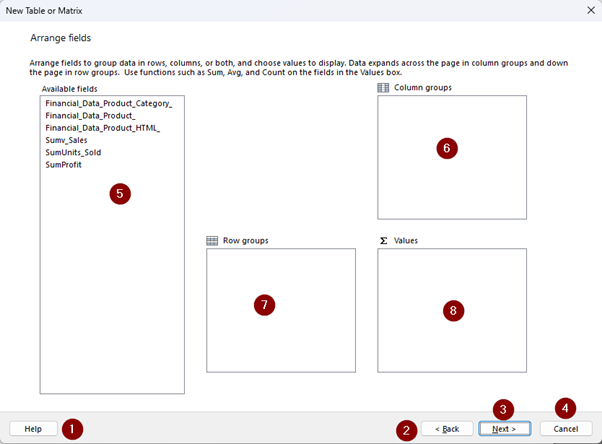
- Help button
- Back button
- Next button
- Cancel button
- Available fields list
- Column Groups list
- Row Groups list
- Values list
To move through the fields list, use the Up and Down arrow keys, a screen reader reads out the field names as you move across the list. To add a field to either of the groups, make sure focus is on it and then press Enter, it will add the selected field to Row Groups list. To move it from the Row groups to either the Column groups or Values section use Ctrl + Arrow keys until it is added to the appropriate section.
To apply aggregations such as SUM to a numeric field, make sure focus is on the field in the Values list. Use Alt + Down arrow keys to open the sub-menu containing all the aggregations. To navigate through the aggregation list, use Up and Down arrow keys, then press Enter on the aggregation you want to use. This will apply that aggregation to that field.
To move to the next step, press Alt + N or use Tab key to navigate to the Next button and press the Enter key. This opens a new menu where you get to choose the layout for the table as shown in the following image:
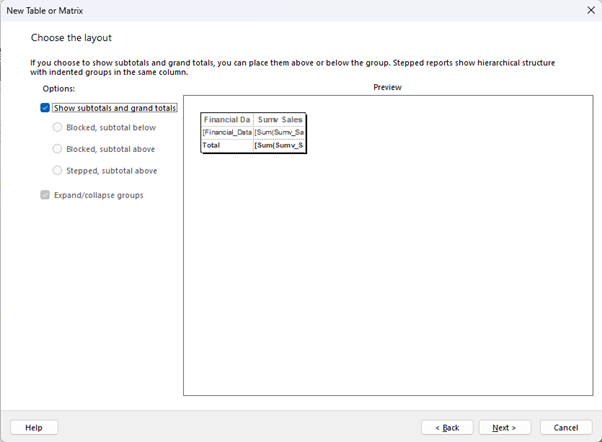
This step is also accessible through keyboard navigation and screen-readers. Once table layout is confirmed, press Alt + N keys or use Tab key to navigate through it and then press Enter key once focus is on the Next button. It will show the preview of the table. Use Alt + F keys or use the Tab key to navigate to the Finish button and then press Enter key once focus is on it. Once this is done, the table will be added to the report body.
Note
All dialogs in Power BI Report Builder are keyboard navigable except for the Expression dialog. Items can't be added to the Expression dialog with any of the keyboard keys.
Related content
Feedback
Coming soon: Throughout 2024 we will be phasing out GitHub Issues as the feedback mechanism for content and replacing it with a new feedback system. For more information see: https://aka.ms/ContentUserFeedback.
Submit and view feedback for