Note
Access to this page requires authorization. You can try signing in or changing directories.
Access to this page requires authorization. You can try changing directories.
APPLIES TO:
Power BI Report Builder
Power BI Desktop
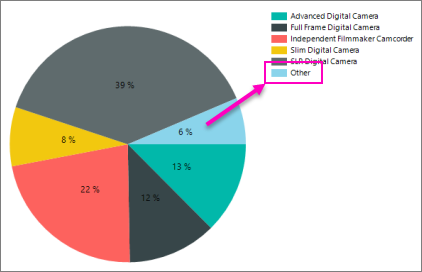
In Power BI paginated reports, by default the legend shows categories. You may also want percentages in the legend or the pie slices themselves.

The Tutorial: Add a Pie Chart to Your Report (Power BI Report Builder) walks you through adding percentages to pie slices, if you'd like to try this with sample data first.
Display percentage values as labels on a pie chart
Add a pie chart to your report. For more information, see Add a Chart to a Report (Power BI Report Builder).
On the design surface, right-click on the pie and select Show Data Labels. The data labels should appear within each slice on the pie chart.
On the design surface, right-click on the labels and select Series Label Properties. The Series Label Properties dialog box appears.
Type #PERCENT for the Label data option.
(Optional) To specify how many decimal places the label shows, type "#PERCENT{Pn}" where n is the number of decimal places to display. For example, to display no decimal places, type "#PERCENT{P0}".
Display percentage values in the legend of a pie chart
On the design surface, right-click on the pie chart and select Series Properties. The Series Properties dialog box displays.
In Legend, type #PERCENT for the Custom legend text property.