Note
Access to this page requires authorization. You can try signing in or changing directories.
Access to this page requires authorization. You can try changing directories.
You can store and manage Power BI reports on premises in the Power BI Report Server web portal, just as you can store Power BI reports in the cloud in the Power BI service (https://powerbi.com). You create and edit reports in Power BI Desktop, and publish them to the web portal. Then report readers in your organization can view them in a browser or in a Power BI mobile app on a mobile device.
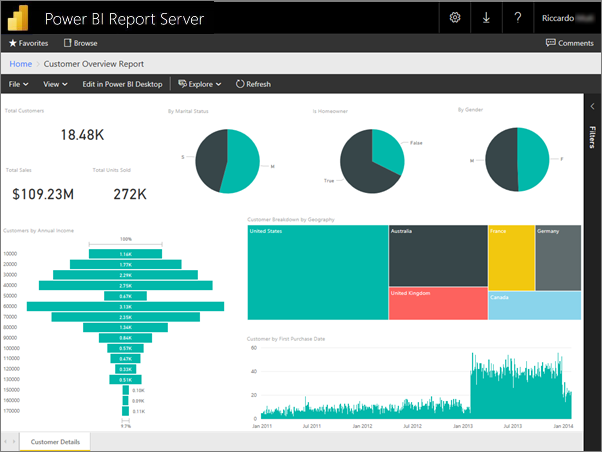
Here are four quick steps to get you started.
Step 1: Install Power BI Desktop for Power BI Report Server
If you've already created Power BI reports in Power BI Desktop, then you're almost ready to create Power BI reports for Power BI Report Server. We recommend installing the version of Power BI Desktop for Power BI Report Server so you know the server and the app are always in sync. You can have both versions of Power BI Desktop on the same computer.
In the report server web portal, select the Download arrow > Power BI Desktop.
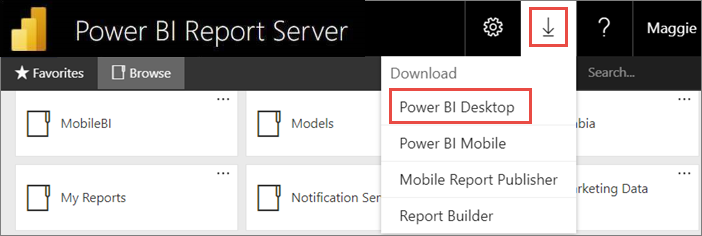
Or, go to the Power BI Report Server home page and select Advanced download options.
In the Download Center page, select Download.
Depending on your computer, select:
PBIDesktopRS.msi (the 32-bit version) or
PBIDesktopRS_x64.msi (the 64-bit version).
After you download the installer, run the Power BI Desktop Setup Wizard.
At the end of the installation, check Start Power BI Desktop now.
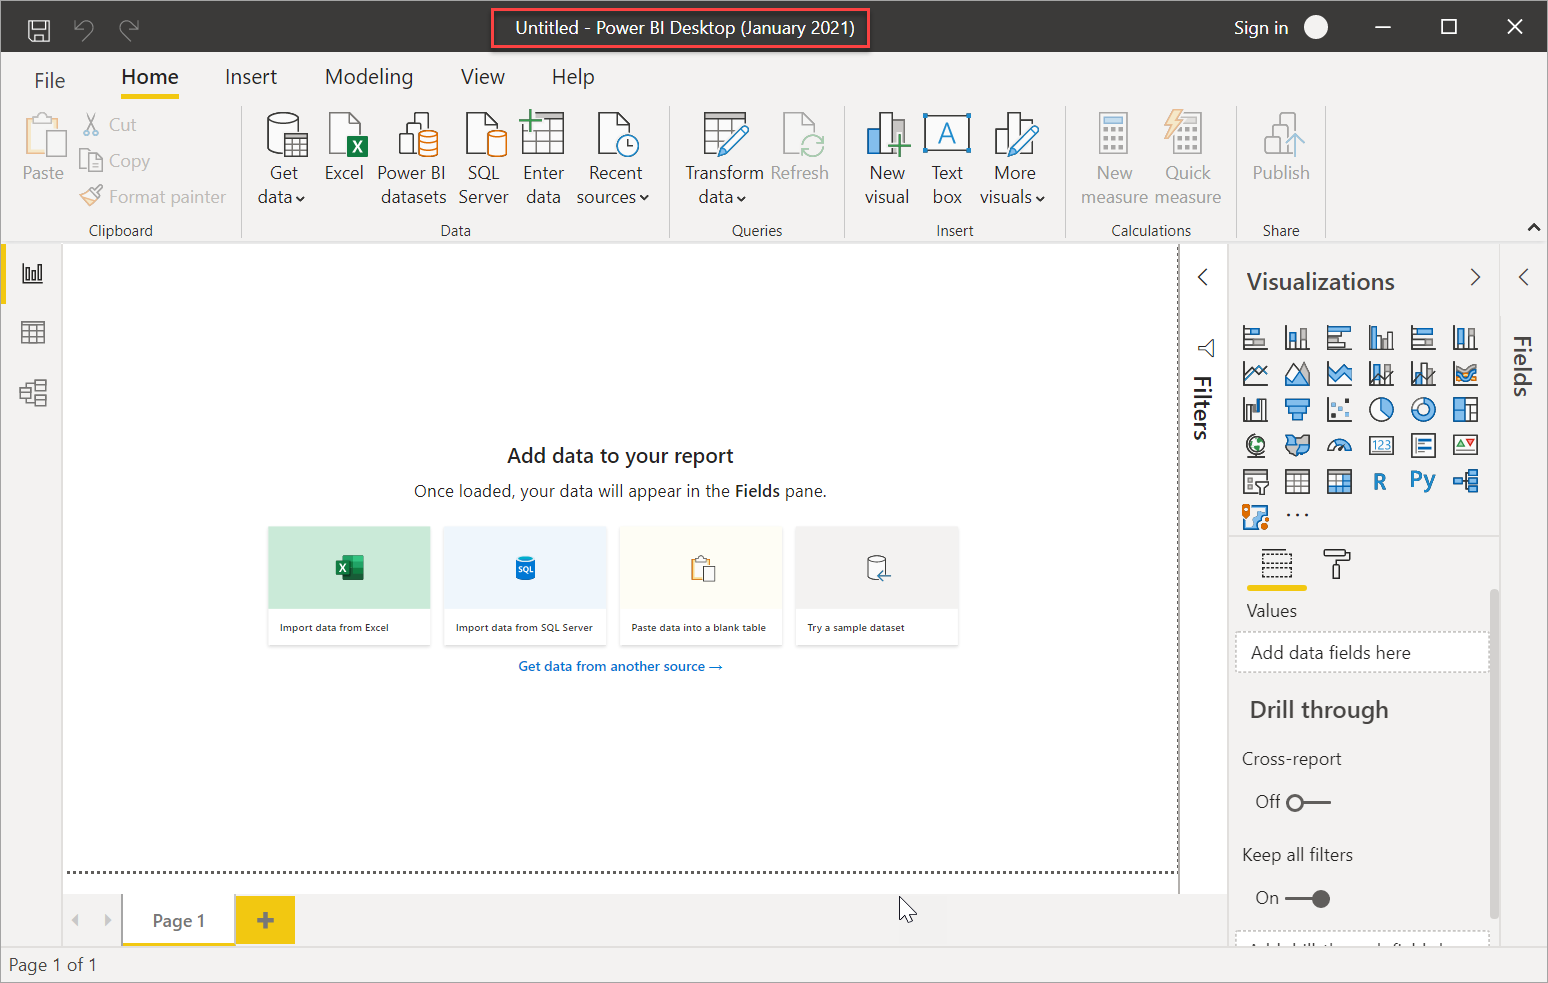
It starts automatically and you're ready to go. You can tell you have the right version because Power BI Desktop (September 2025) is in the title bar.
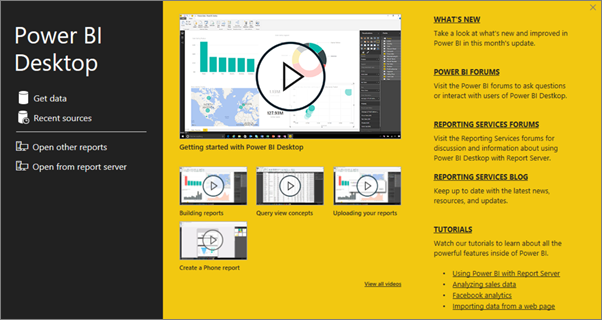
If you're not familiar with Power BI Desktop, consider watching the videos on the welcome screen.
Step 2: Select a data source
You can connect to a variety of data sources. Read more about connecting to data sources.
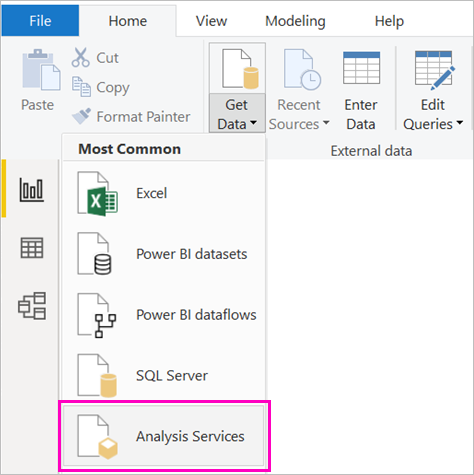
From the welcome screen, select Get Data.
Or on the Home tab, select Get Data.
Select your data source -- in this example, Analysis Services.
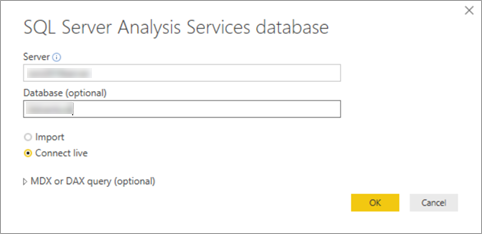
Fill in Server, and optionally, Database. Make sure Connect live is selected > OK.
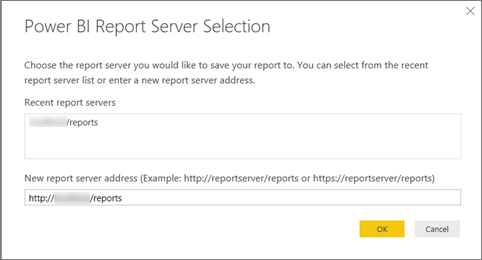
Choose the report server where you'll save your reports.
Step 3: Design your report
Here's the fun part: You get to create visuals that illustrate your data.
For example, you could create a funnel chart of customers and group values by yearly income.
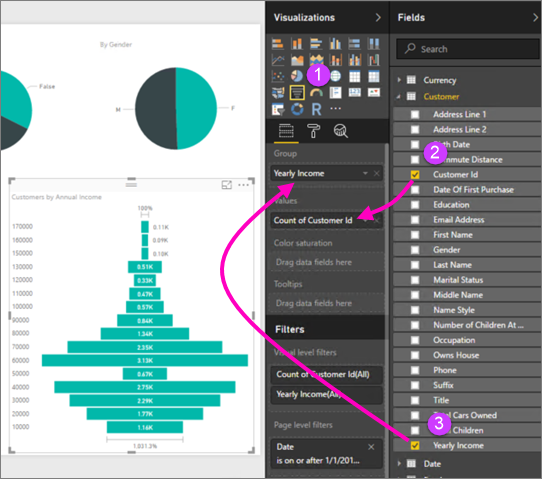
- In Visualizations, select Funnel chart.
- Drag the field to be counted to the Values well. If it's not a numeric field, Power BI Desktop automatically makes it a Count of the value.
- Drag the field to group on to the Group well.
Read much more about designing a Power BI report.
Note
Some visuals such as paginated report visual will only work on the Power BI service only. Rendering these visuals on Power BI Report Server will give an "Unsupported visual" error.
Step 4: Save your report to the report server
Note
Power BI Desktop only supports integrated authentication for publishing reports to Power BI Report Server. Basic authentication is not supported; for this use case, you can use the portal.
When your report is ready, you save it to the Power BI Report Server you chose in Step 2.
On the File menu, select Save as > Power BI Report Server.
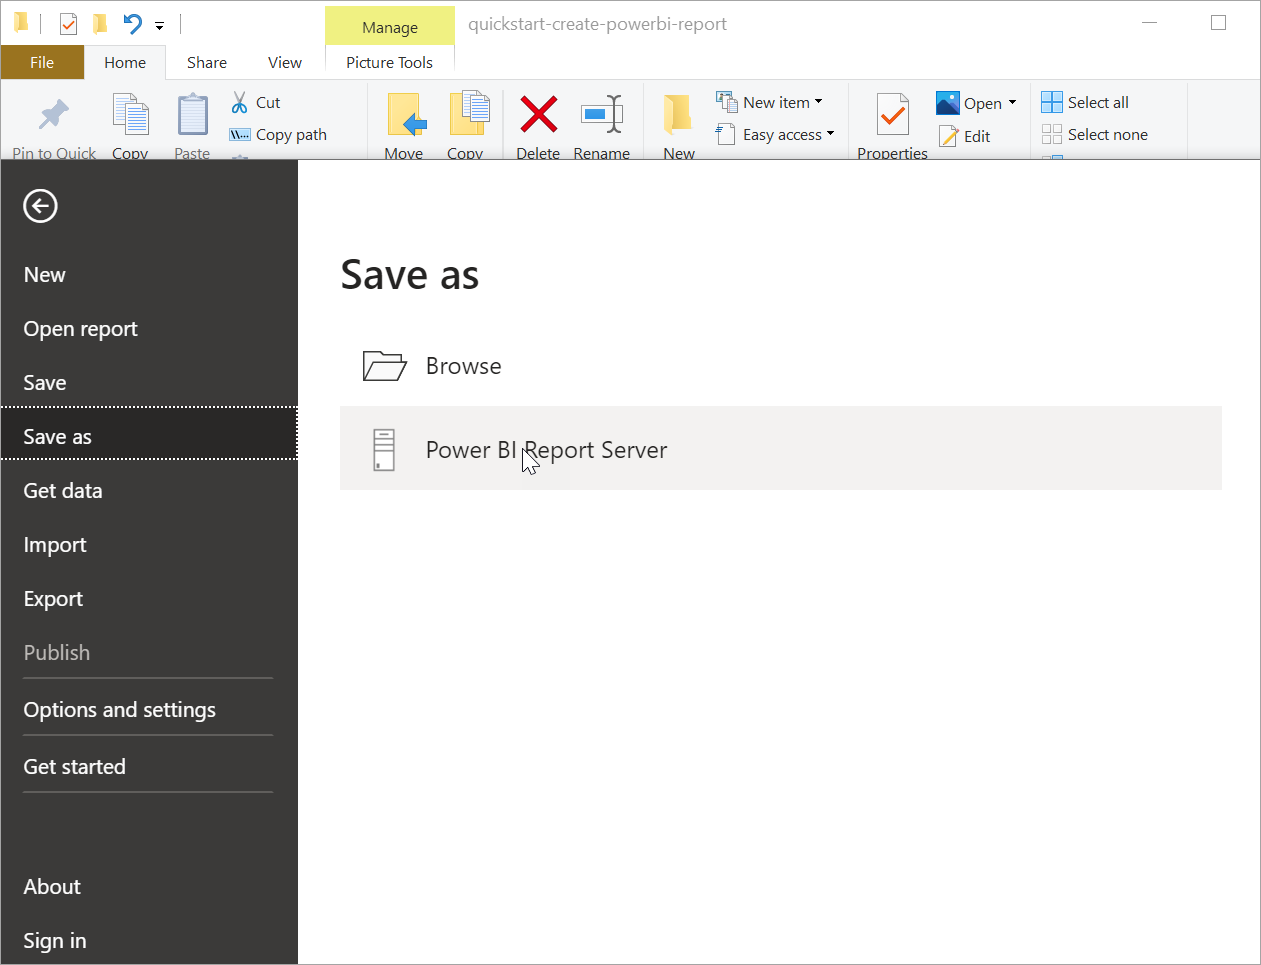
Now you can view it in the web portal.

Note
If you choose to edit the report in the future, the report data you see in the desktop will always be the cached data from when the report was initially created. To view the latest data when editing the report, you must refresh the data in your Power BI Desktop application.
Related content
Power BI Desktop
There are so many great resources for creating reports in Power BI Desktop. This link is a good starting point.
- Get started with Power BI Desktop
- Guided learning: Explore Power BI Desktop
Power BI Report Server
More questions? Try asking the Power BI Community