Note
Access to this page requires authorization. You can try signing in or changing directories.
Access to this page requires authorization. You can try changing directories.
With calculated columns, you can add new data to a table already in your model. But instead of querying and loading values into your new column from a data source, you create a Data Analysis Expressions (DAX) formula that defines the column's values. In Power BI Desktop, calculated columns are created by using the new column feature in Report view, Table view, or Model view.
Unlike custom columns that are created as part of a query by using Add Custom Column in Power Query Editor, calculated columns that are created in Report view, Table view, or Model view are based on data you've already loaded into the model. For example, you might choose to concatenate values from two different columns in two different but related tables, do addition, or extract substrings.
Calculated columns you create appear in the Fields list just like any other field, but they have a special icon showing its values are the result of a formula. You can name your columns whatever you want, and add them to a report visualization just like other fields.
Calculated columns calculate results by using DAX, a formula language meant to work with relational data like in Power BI Desktop. DAX includes a library of over 200 functions, operators, and constructs. It provides immense flexibility in creating formulas to calculate results for just about any data analysis need. To learn more about DAX, see Learn DAX basics in Power BI Desktop.
DAX formulas are similar to Excel formulas. In fact, DAX has many of the same functions as Excel. DAX functions, however, are meant to work over data interactively sliced or filtered in a report, like in Power BI Desktop. In Excel, you can have a different formula for each row in a table. In Power BI, when you create a DAX formula for a new column, it calculates a result for every row in the table. Column values are recalculated as necessary, like when the underlying data is refreshed and values have changed.
Let's look at an example
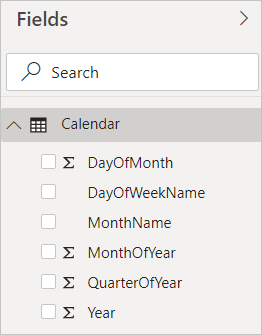
Jeff is a shipping manager at Contoso, and wants to create a report showing the number of shipments to different cities. Jeff has a Geography table with separate fields for city and state. But, Jeff wants their reports to show the city and state values as a single value on the same row. Right now, Jeff's Geography table doesn't have the wanted field.
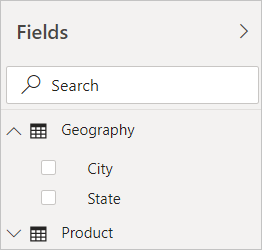
But with a calculated column, Jeff can put together the cities from the City column with the states from the State column.
Jeff right-clicks on the Geography table and then selects New Column. Jeff then enters the following DAX formula into the formula bar:
CityState = [City] & "," & [State]
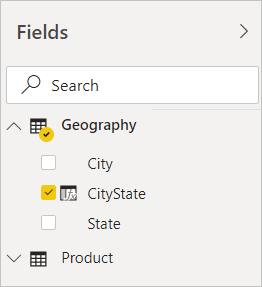
This formula creates a new column named CityState. For each row in the Geography table, it takes values from the City column, adds a comma and a space, and then concatenates values from the State column.
Now Jeff has the wanted field.
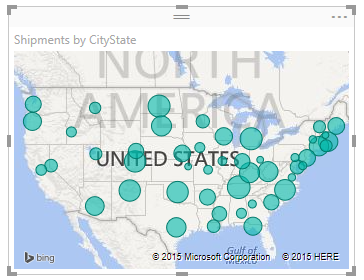
Jeff can now add it to the report canvas along with the number of shipments. With minimal effort, Jeff now has a CityState field that can be added to just about any type of visualization. When Jeff creates a new map, Power BI Desktop already knows how to read the city and state values in the new column.
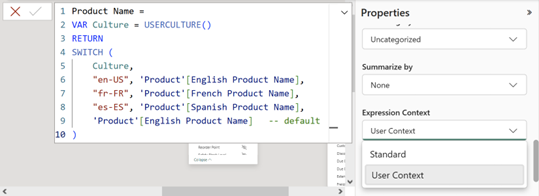
Expression Context
The Expression Context property determines whether user-context-aware DAX expressions such as the following can be dynamically evaluated.
User-context-aware calculated columns enable unique scenarios such as data translations for multi-lingual semantic models. See data translations for more information.
The Expression Context property can be set as a calculated-column property.
Materialization and performance
Calculated-column materialization should be taken into consideration with regard to performance optimization. DAX authoring best practices should be adhered to avoid expensive operations on evaluation of calculated columns.
- Unmaterialized calculated columns can negatively impact query performance because values need to be derived at query time.
- Materialized calculated columns can negatively impact refresh performance because values need to be derived at refresh time.
The following table shows the combinations of table storage mode and supported Expression Context settings.
| Storage mode | Standard (default) | User Context |
|---|---|---|
| Import | Materialized | Unmaterialized |
| Direct Lake on OneLake | Unmaterialized | Unmaterialized |
| Direct Lake on SQL | N/A | N/A |
| DirectQuery | Unmaterialized | Unmaterialized |
| Dual | Materialized (Import), unmaterialized (DirectQuery) | Unmaterialized |
| DirectQuery on Power BI semantic models | Unmaterialized | N/A |
Related content
This article provides a quick introduction to calculated columns here. For more information, see the following resources:
To download a sample file and get step-by-step lessons on how to create more columns, see Tutorial: Create calculated columns in Power BI Desktop.
To learn more about DAX, see Learn DAX basics in Power BI Desktop.
To learn more about columns you create as part of a query, see Create custom columns.