Import and display KPIs in Power BI
With Power BI Desktop, you can import and display KPIs in tables, matrices, and cards.
To import and display KPIs:
Start with an Excel workbook that has a Power Pivot model and KPIs.
Import the Excel workbook into Power BI, by using File -> Import -> Power Query, Power Pivot, Power View. You can also learn how to import workbooks.
After import into Power BI, your KPI will appear in the Fields pane, marked with the
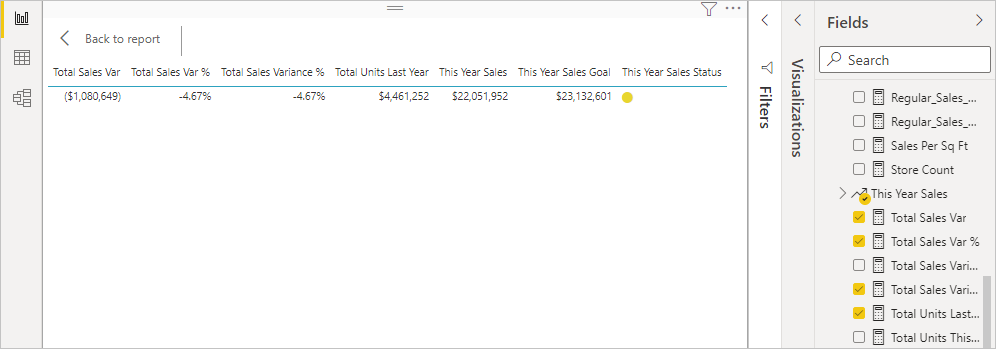
 icon. To use a KPI in your report, be sure to expand its contents, exposing the Value, Goal, and Status fields.
Imported KPIs are best used in standard visualization types, such as the Table type. Power BI also includes the KPI visualization type, which should only be used to create new KPIs.
You can use KPIs to highlight trends, progress, or other important indicators.
