Note
Access to this page requires authorization. You can try signing in or changing directories.
Access to this page requires authorization. You can try changing directories.
Model view shows all of the tables, columns, and relationships in your model. This view can be especially helpful when your model has complex relationships between many tables.
Select the Model view icon near the side of the window to see a view of the existing model. Hover your cursor over a relationship line to show the columns used.

In the image, the Connections table has a Seat ID column related to the Unique Seats table, which also has a seatId column. The two tables have a Many to One (*:1) relationship. An arrow in the middle of the line shows the direction of the filter context flow. Double arrows would mean the cross-filter direction is set to Both.
You can double-click a relationship to open it in the Edit relationship dialog box. For more information about relationships, see Create and manage relationships in Power BI Desktop.
Updated Model View
Current releases of Power BI Desktop have the updated Model view enabled.
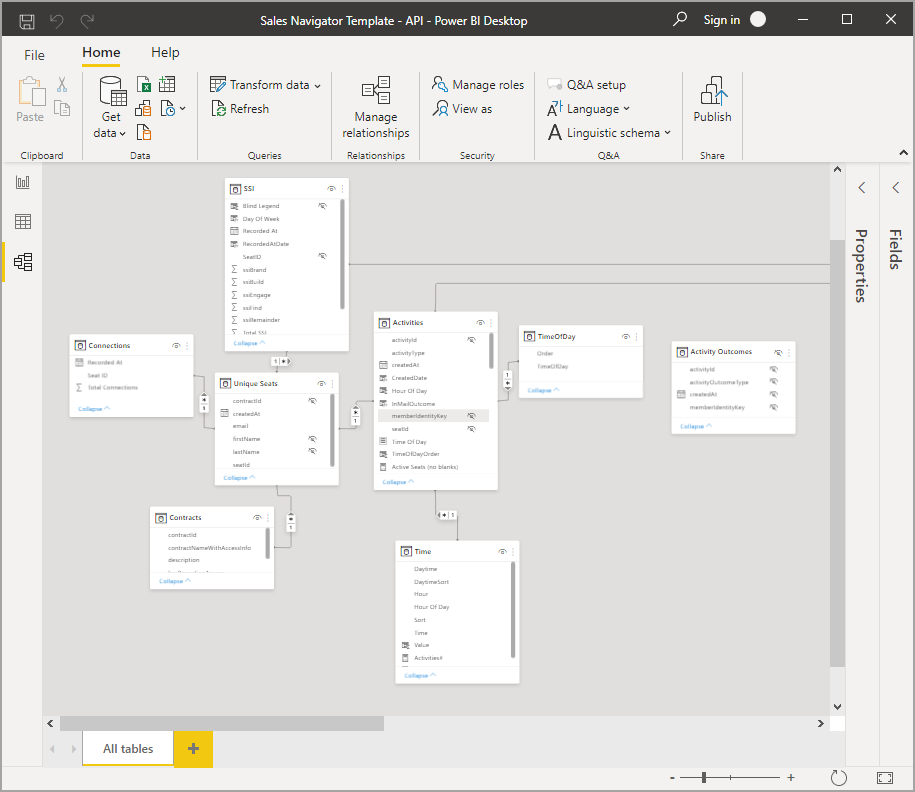
The colors in the table card headers automatically match the colors you've selected in any report theme you're using. If the color is too close to white, Model view doesn't use it in the theme headers to avoid situations where it's difficult to differentiate tables in dual mode. In the previous image the card headers are white; if the report theme was using blue, the card headers in the Model view shown in the previous image would be blue instead of white.
If your model has fewer than 75 tables, Model view shows all of your tables. If your model has more than 75 tables, instead of showing all tables you see the following image:
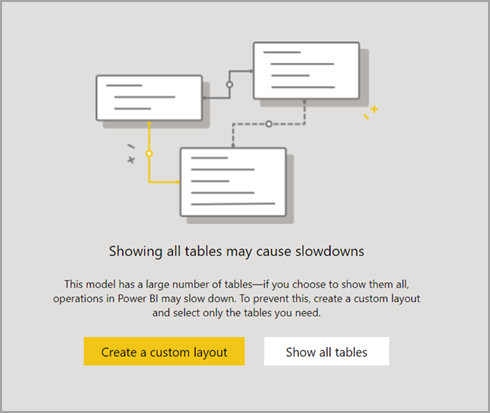
When your model has more than 75 tables, Power BI Desktop warns you that slowdowns might occur. Create a custom layout (select the Create a custom layout button) to reduce the significant CPU and memory used when Model view shows more than 75 tables.
Related content
There are all sorts of things you can do with Power BI Desktop. For more information on data sources, see the following resources: