Visual axis zooming
Important
This content is archived and is not being updated. For the latest documentation, see Microsoft Power Platform product documentation. For the latest release plans, see Dynamics 365 and Microsoft Power Platform release plans.
| Enabled for | Public preview | General availability |
|---|---|---|
| Users by admins, makers, or analysts | - |  Nov 16, 2020
 |
Feature details
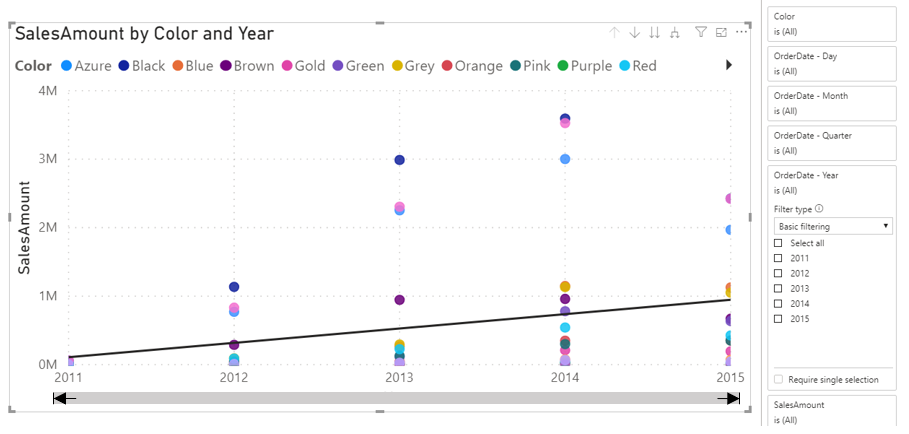
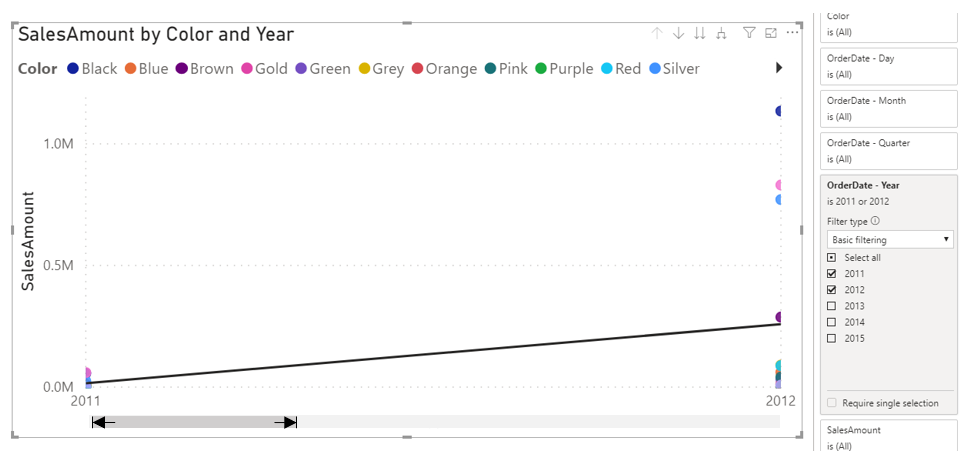
Visual zooming adjusts the level of detail being displayed in a visual without losing contextual information about the rest of the data. For example, unlike filters, changing the zoom of a visual won't recalculate trendlines for the data with fewer data points.
![NOTE] The screenshot examples show recalculation with filters, but otherwise demonstrates the functionality of this feature.


See also
Visual zoom slider (docs)
Work with Power BI visuals (learn)