Note
Access to this page requires authorization. You can try signing in or changing directories.
Access to this page requires authorization. You can try changing directories.
Important
This content is archived and is not being updated. For the latest documentation, go to What's new in Power BI?. For the latest release plans, go to Dynamics 365 and Microsoft Power Platform release plans.
| Enabled for | Public preview | General availability |
|---|---|---|
| Users, automatically |  May 2, 2022
 |
 Mar 29, 2023
 |
Business value
Create well-formatted tables from the same dataset that you use in Power BI. Filter data, resize columns, and apply one of the many styles to the table. You can also export the report to Excel, PDF, or PowerPoint.
Feature details
You can create formatted tables from Power BI datasets using a simple What You See Is What You Get (WYSIWYG) experience in the Power BI service. Features include:
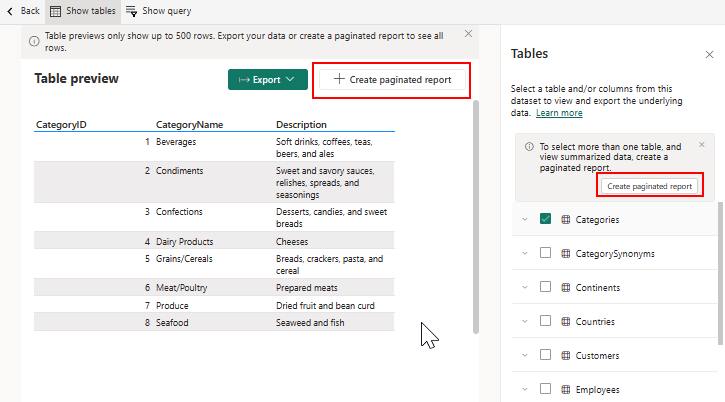
Create and style a table from a Power BI dataset: Preview the data from the table by selecting fields from the Tables pane. You can edit or customize the report by selecting Create paginated report.
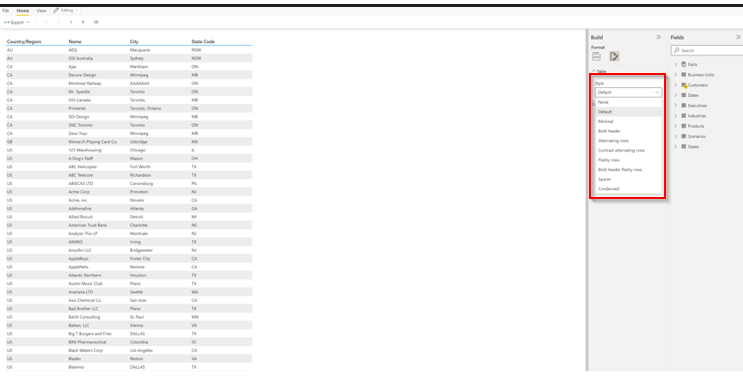
Improve the presentation by selecting the Format tab in the Build pane.
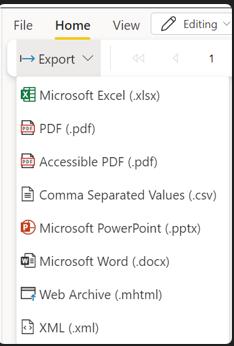
Export to Excel, PDF, PPTX, and other supported formats: Export a paginated report by selecting Export while you're viewing or editing the report.
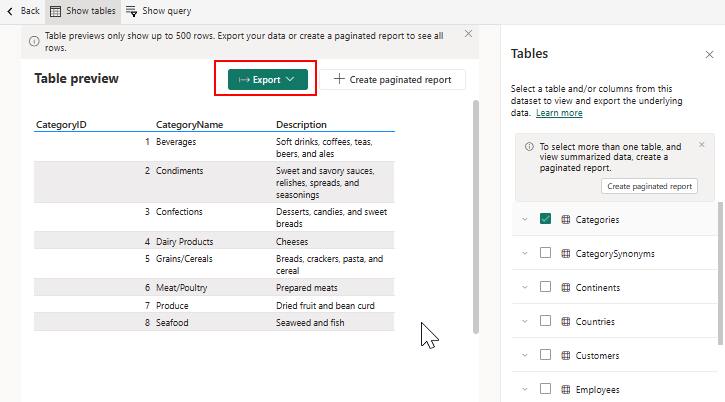
You can also export the paginated report from Data Preview.
Opening a report in Report Builder for advanced editing scenarios: Continue editing your report in Report Builder while Viewing a report from the File menu.

Moving tables: Place tables anywhere on the page in Editing mode by selecting the table and dragging it on the canvas.
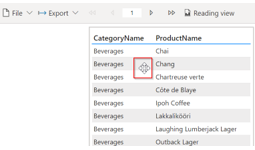
Resizing columns: Change the width of columns by dragging to the desired width. Hover around the column header in either Data Preview or Editing modes to resize.
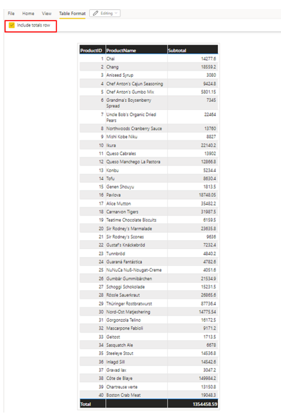
Displaying totals: Include or exclude Totals in either Data Preview or Editing modes by selecting Include Totals.
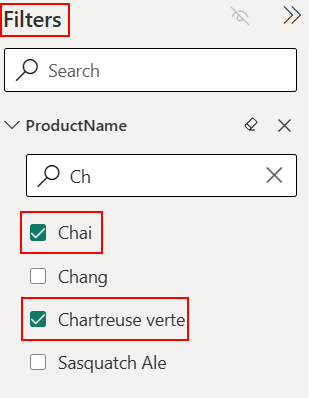
Filtering data: Create a report with the most relevant data by Filtering the data in the Filter pane.
- You can easily search for columns and data that you want to include in your report.
- Drag and drop columns to the Filter pane that you may want to filter by but don't want to appear in your report.
Subscribing to the report on a daily, weekly, or monthly basis.
See also
Create exportable formatted data tables in the Power BI service (docs)