Note
Access to this page requires authorization. You can try signing in or changing directories.
Access to this page requires authorization. You can try changing directories.
Tenant-level analytics allow Power Platform admins to extract key service metrics based on user adoption across the environments they manage. Tailor made analytics are contained within reports embedded in the Power Platform admin center.
The following tenant-level reports are available for Power Automate Cloud flows.
Power Automate - Usage reports
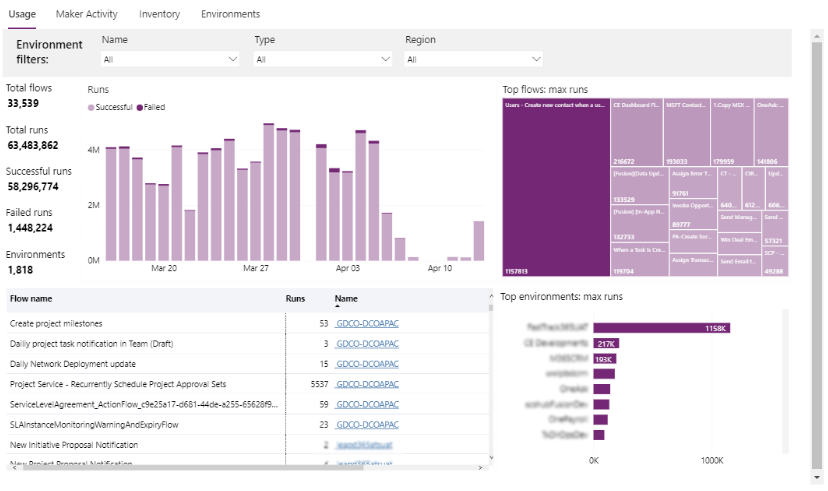
Power Automate reports provide insights into tenant and environment usage and inventory of all flows and connectors. The report answers questions such as:
- What is the total count of active Cloud flows across the tenant or environments?
- What is the count of Successful vs Failed runs across Cloud flows?
- How many flows exist in my tenant or environment?
- Which of my environments had the most unique users?
- What were the top flows across my tenant or environments by runs?
Note
The service only starts collecting the data visualized in the Usage report when the feature is enabled. It can take up to 12 hours to reflect service activities from the previous day.
Report metrics
| Calculation | Description |
|---|---|
| Total flows | Count of Cloud flows with usage events in the past 30 days |
| Total runs | Total number of Cloud flow runs initiated in the past 30 days |
| Successful runs | Count of successful Cloud flow runs completed in the past 30 days |
| Failed runs | Total number of failed Cloud flow runs attempted in the past 30 days |
| Environments | Count of Environments included in the current view |
Report filters
| Scope | Filter | Description |
|---|---|---|
| Environment | Name | Friendly name used to identify a given environment |
| Type | Type of environments to include in the current view | |
| Region | Global regions hosting environments |
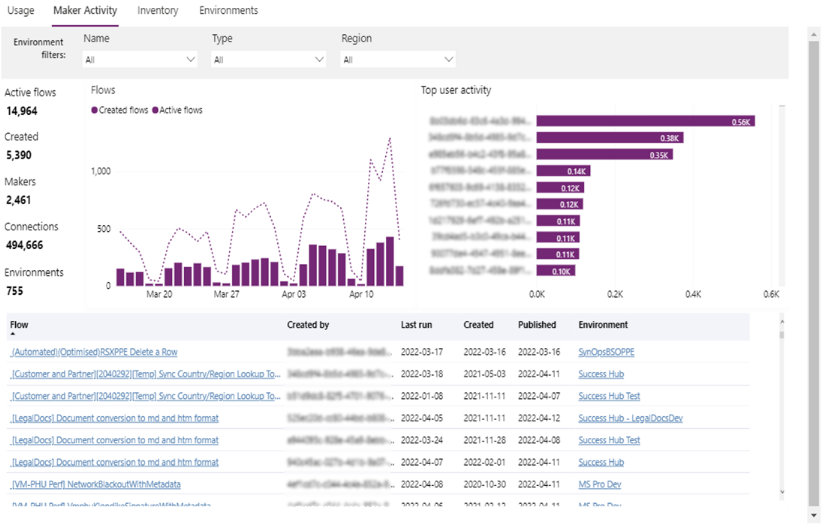
Power Automate - Maker Activity report
The Power Automate report provides insights into the activities of citizen authors of Cloud flows across the tenant or environments. The report answers questions such as:
- What is the total number of flows created by makers across the tenant or environments?
- What is the count of first-time makers across Cloud flows?
- Who are the top makers across the tenant or environments?
- What is the total number of connections consumed in one or more environments?
Note
The service only starts collecting the data visualized in the Maker Activity report when the feature is enabled. It can take up to 12 hours to reflect service activities from the previous day.
Report metrics
| Calculation | Description |
|---|---|
| Active flows | Number of flows that have been triggered and executed within the last 30 days |
| Created | Number of Power Apps created within the current view |
| Makers | Total makers with activity registered in the last 30 days |
| Connections | Count of unique connections referenced within the current view |
| Environments | Count of Environments included in the current view |
Report filters
| Scope | Filter | Description |
|---|---|---|
| Environment | Name | Friendly name used to identify a given environment |
| Type | Type of environments to include in the current view | |
| Region | Global regions hosting environments | |
| App | App type | Toggle between usage statistics for canvas and model-driven apps |
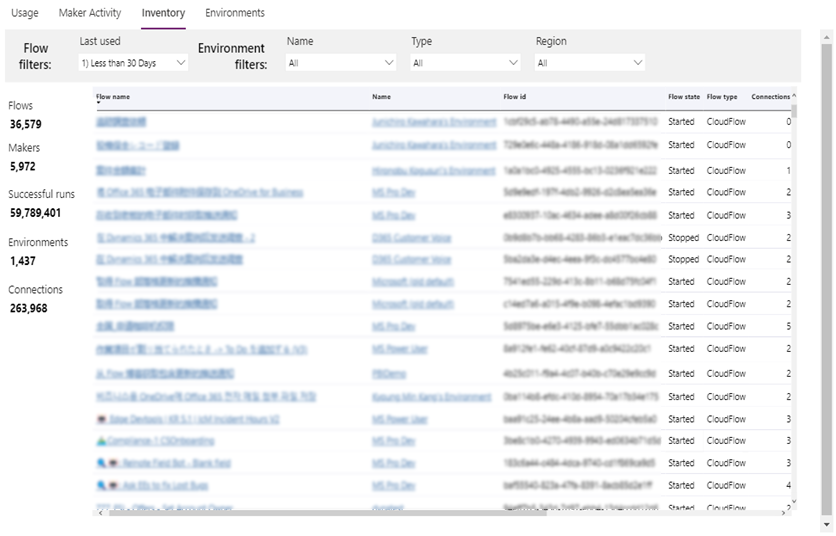
Power Automate - Inventory report
The Power Automate Inventory report offers a complete catalog of Cloud flows distributed across the tenant. This view includes filters that allow admins to search for flows based on various criteria. The report answers questions such as:
- What is the total number of Cloud flows across the tenant or environments?
- Which flows depend on specific connectors?
- Who are the owners of the flows hosted in one or more environments?
- What is the distribution of Cloud flows apps across the organization?
Note
Depending on the size of the organization, it can take up to 24 hours to initially populate the data sets backing the Inventory report.
Report metrics
| Calculation | Description |
|---|---|
| Flows | Count of Cloud flows included in the current view |
| Makers | Count of Makers with activity registered in the last 30 days |
| Successful runs | Total number of successful Cloud flow runs completed in the past 30 days |
| Environments | Count of Environments included in the current view |
| Connections | Count of unique connections referenced within the current view |
Report filters
| Level | Filter | Description |
|---|---|---|
| App | Last opened | Used to filter results based on ‘Last run’ date |
| Environment | Name | Friendly name used to identify a given environment |
| Type | Type of environments to include in the current view | |
| Region | Global regions hosting environments |
Download Inventory
Power Platform admin center reports can be downloaded directly from the report visuals. Users have the option of choosing between Summarized and Underlying data.
- Summarized data: select this option to download the data underlying the current report visual
- Underlying data: select this option to download the full result set backing the report

For more information on downloading data from the tenant level reports, see Exporting data from Power BI visuals.