Note
Access to this page requires authorization. You can try signing in or changing directories.
Access to this page requires authorization. You can try changing directories.
Navigation Tables (or nav tables) are a core part of providing a user-friendly experience for your connector. The Power Query experience displays them to the user after they've entered any required parameters for your data source function, and have authenticated with the data source.
Behind the scenes, a nav table is just a regular M Table value with specific metadata fields defined on its Type. When your data source function returns a table with these fields defined, Power Query will display the navigator dialog. You can actually see the underlying data as a Table value by right-clicking on the root node and selecting Edit.
Table.ToNavigationTable
You can use the Table.ToNavigationTable function to add the table type metadata needed to create a nav table.
Note
You currently need to copy and paste this function into your M extension. In the future it will likely be moved into the M standard library.
The following table describes the parameters for this function:
| Parameter | Details |
|---|---|
| table | Your navigation table. |
| keyColumns | List of column names that act as the primary key for your navigation table. |
| nameColumn | The name of the column that should be used as the display name in the navigator. |
| dataColumn | The name of the column that contains the Table or Function to display. |
| itemKindColumn | The name of the column to use to determine the type of icon to display. See below for the list of valid values for the column. |
| itemNameColumn | The name of the column to use to determine the preview behavior. This is typically set to the same value as itemKind. |
| isLeafColumn | The name of the column used to determine if this is a leaf node, or if the node can be expanded to contain another navigation table. |
The function adds the following metadata to the table type:
| Field | Parameter |
|---|---|
| NavigationTable.NameColumn | nameColumn |
| NavigationTable.DataColumn | dataColumn |
| NavigationTable.ItemKindColumn | itemKindColumn |
| NavigationTable.IsLeafColumn | isLeafColumn |
| Preview.DelayColumn | itemNameColumn |
Values for ItemKind
Each of the following item kind values provide a different icon in the navigation table.
- Feed
- Database
- DatabaseServer
- Dimension
- Table
- Folder
- Function
- View
- Sheet
- DefinedName
- Record
Examples
Flat navigation table
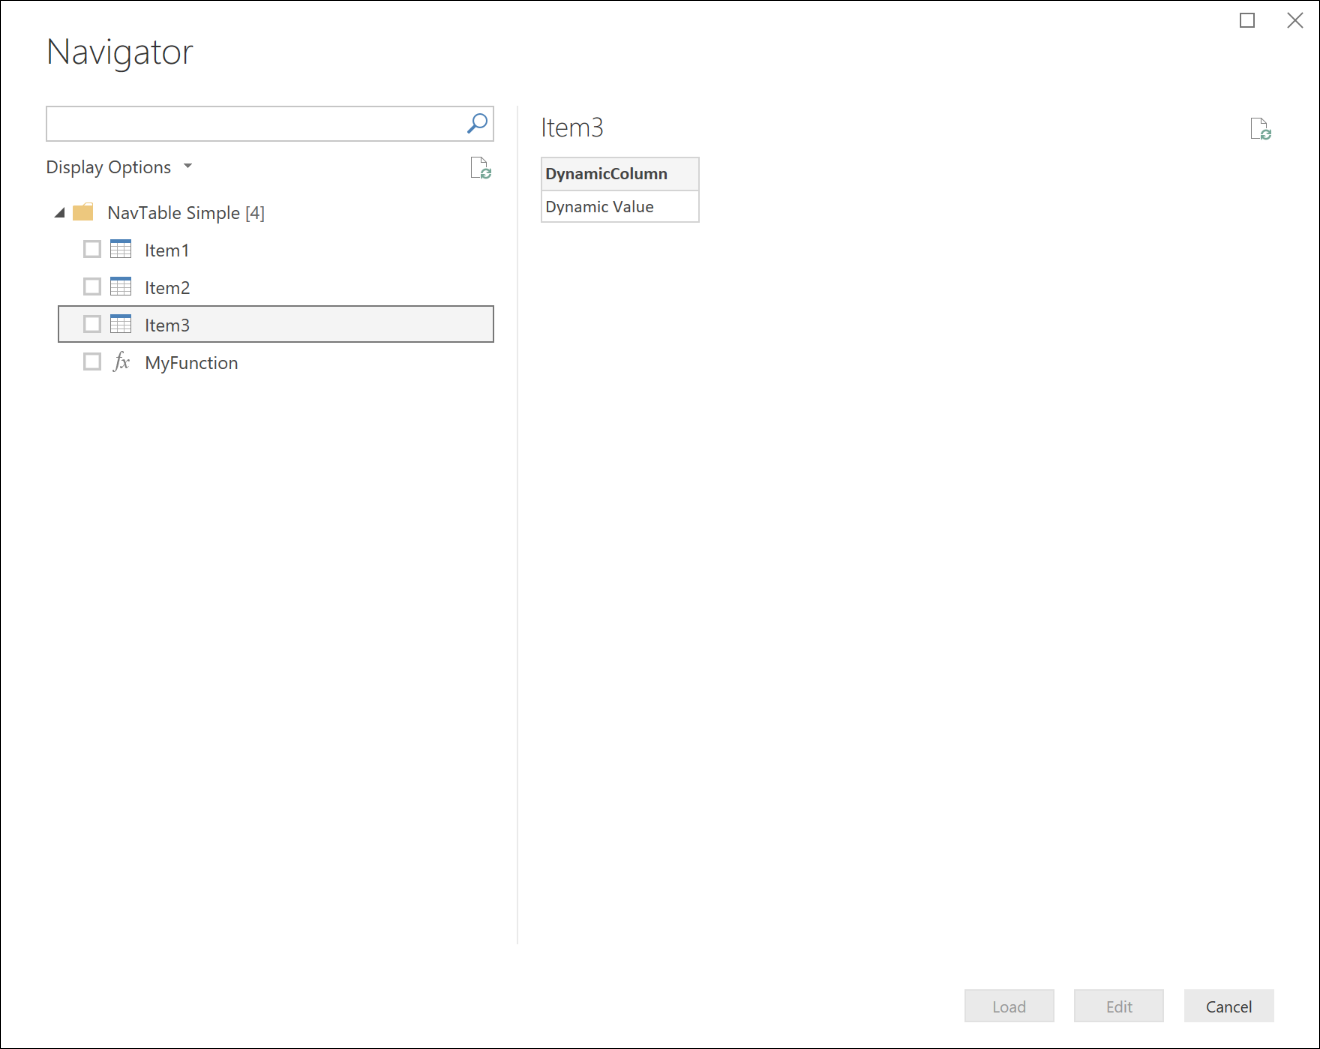
The following code sample displays a flat nav table with three tables and a function.
shared NavigationTable.Simple = () =>
    let
        objects = #table(
            {"Name",       "Key",        "Data",                           "ItemKind", "ItemName", "IsLeaf"},{
            {"Item1",      "item1",      #table({"Column1"}, {{"Item1"}}), "Table",    "Table",    true},
            {"Item2",      "item2",      #table({"Column1"}, {{"Item2"}}), "Table",    "Table",    true},
            {"Item3",      "item3",      FunctionCallThatReturnsATable(),  "Table",    "Table",    true},
            {"MyFunction", "myfunction", AnotherFunction.Contents,       "Function", "Function", true}
            }),
        NavTable = Table.ToNavigationTable(objects, {"Key"}, "Name", "Data", "ItemKind", "ItemName", "IsLeaf")
    in
        NavTable;

shared FunctionCallThatReturnsATable = () =>
    #table({"DynamicColumn"}, {{"Dynamic Value"}});
This code will result in the following Navigator display in Power BI Desktop:
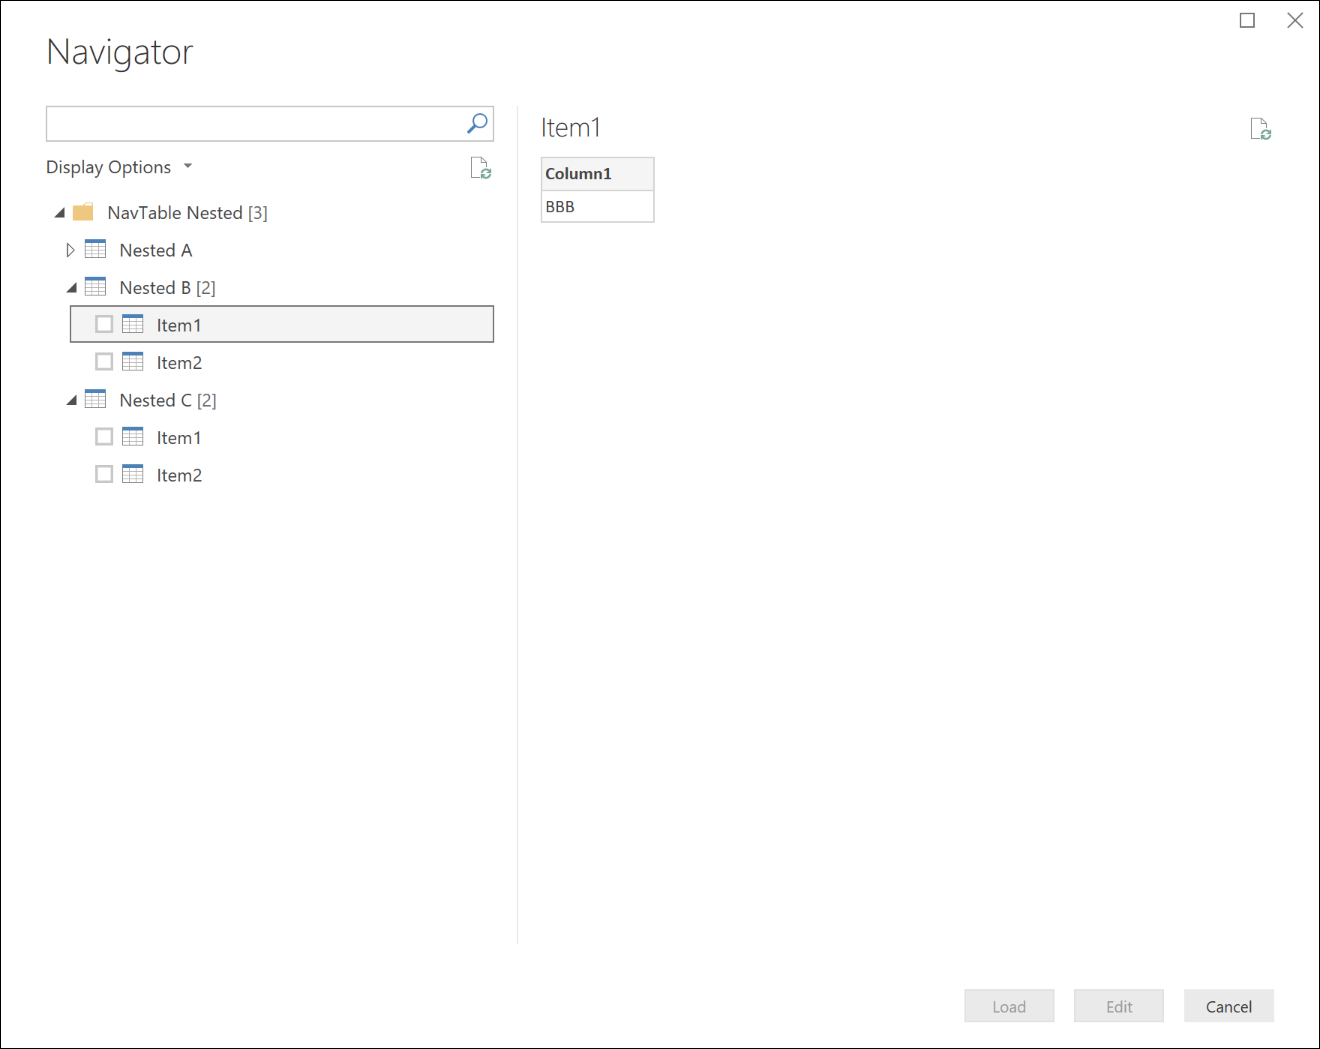
Multi-level navigation table
It is possible to use nested navigation tables to create a hierarchical view over your data set. You do this by setting the IsLeaf value for that row to false (which marks it as a node that can be expanded), and format the Data column to also be another nav table.
shared NavigationTable.Nested = () as table =>
    let
        objects = #table(
            {"Name",       "Key",  "Data",                "ItemKind", "ItemName", "IsLeaf"},{
            {"Nested A",   "n1",   CreateNavTable("AAA"), "Table",    "Table",    false},
            {"Nested B",   "n2",   CreateNavTable("BBB"), "Table",    "Table",    false},
            {"Nested C",   "n3",   CreateNavTable("CCC"), "Table",    "Table",    false}
        }),
        NavTable = Table.ToNavigationTable(objects, {"Key"}, "Name", "Data", "ItemKind", "ItemName", "IsLeaf")
    in
        NavTable;

CreateNavTable = (message as text) as table =>
    let
        objects = #table(
            {"Name",  "Key",   "Data",                           "ItemKind", "ItemName", "IsLeaf"},{
            {"Item1", "item1", #table({"Column1"}, {{message}}), "Table",    "Table",    true},
            {"Item2", "item2", #table({"Column1"}, {{message}}), "Table",    "Table",    true}
        }),
        NavTable = Table.ToNavigationTable(objects, {"Key"}, "Name", "Data", "ItemKind", "ItemName", "IsLeaf")
    in
        NavTable;
This code would result in the following Navigator display in Power BI Desktop:
Dynamic navigation tables
More complex functionality can be built from these basics. While all of the above examples show hard-coded entities in the nav table, it's easy to see how a nav table could be generated dynamically based on entities that are available to a given user. A few key considerations for dynamic navigation tables include:
- Error handling to ensure a good experience for users that don't have access to certain endpoints.
- Node evaluation is lazy by default; leaf nodes are not evaluated until the parent node is expanded. Certain implementations of multi-level dynamic nav tables may result in eager evaluation of the entire tree. Be sure to monitor the number of calls that Power Query is making as it initially renders the navigation table. For example, Table.InsertRows is 'lazier' than Table.FromRecords, as it doesn't need to evaluate its arguments.