Note
Access to this page requires authorization. You can try signing in or changing directories.
Access to this page requires authorization. You can try changing directories.
By using Query Diagnostics, you can better understand what Power Query is doing during authoring and at refresh time in Power BI Desktop. While this feature is expanding in the future, including adding the ability to use it during full refreshes, you can currently use it to understand what kind of queries you're emitting, what slowdowns you might run into during authoring refresh, and what kind of background events are happening.
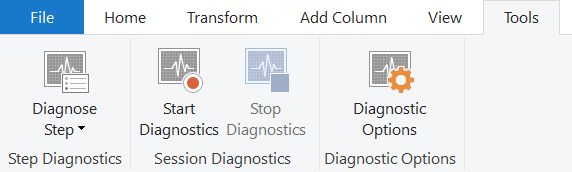
To use Query Diagnostics, go to the Tools tab in the Power Query editor ribbon.
By default, Query Diagnostics might require administrative rights to run (depending on IT policy). If you find yourself unable to run Query Diagnostics, open the Power BI Desktop options page. In the Diagnostics tab, select Enable in Query Editor (doesn't require running as admin). This selection constrains you from being able to trace diagnostics when doing a full refresh into Power BI rather than the Power Query editor, but it does allow you to still use it when previewing and authoring.

Whenever you start diagnostics, Power Query begins tracing any evaluations that you cause. The evaluation that most users think of is when you press refresh, or when you retrieve data for the first time. But there are many actions that can cause evaluations, depending on the connector. For example, with the SQL connector, when you retrieve a list of values to filter, that would kick off an evaluation as well—but it doesn't associate with a user query, and that's represented in the diagnostics. Other system-generated queries might include the navigator or the get data experience.
When you press Diagnose Step, Power Query runs a special evaluation of just the step you're looking at. It then shows you the diagnostics for that step, without showing you the diagnostics for other steps in the query. This evaluation can make it much easier to get a narrow view into a problem.
It's important that if you're recording all traces from Start Diagnostics that you press Stop diagnostics. Stopping the diagnostics allows the engine to collect the recorded traces and parse them into the proper output. Without this step, traces are lost.
Types of diagnostics
There are three types of diagnostics, one of which has two levels of detail.
The first of these diagnostics are the primary diagnostics, which have a detailed view and a summarized view. The summarized view is aimed to give you an immediate insight into where time is being spent in your query. The detailed view is much deeper, line by line, and is, in general, only needed for serious diagnosing by power users.
For this view, some capabilities, like the Data Source Query column, are currently available only on certain connectors.
Data privacy partitions provide you with a better understanding of the logical partitions used for data privacy.
Note
Power Query might perform evaluations that you didn't directly trigger. Some of these evaluations retrieve metadata to optimize queries or provide a better user experience (such as retrieving the list of distinct values within a column that are displayed in the Filter Rows experience). Others might be related to how a connector handles parallel evaluations. If you see repeated queries in your diagnostics that don't make sense, reach out through normal support channels.
Summarized vs. detailed view
Query diagnostics provides two views: summarized and detailed. The summarized view "collapses" multiple related operations into a single operation. In this process, details collected by each operation are combined, and the exclusive durations are summed. No information is lost as part of this process.
The summarized view provides an overview of what occurred during an evaluation for easy high-level review. If further breakdown is wanted for a specific operation, you can look at the group ID and view the corresponding operations that were grouped in the detail view.
Explaining multiple evaluations
When a refresh occurs in the Power Query editor, Power Query performs a lot of work behind the scenes to give you a fluent user experience. For example, when you Refresh Preview, the evaluator executes the final step of each given query. Then in the background, it sequentially runs n-1 steps, n-2 steps, n-3 steps, and each subsequent step. So if you step back through your steps, the result is already available.
To provide higher performance, currently some caching happens so that it doesn't have to rerun every part of the final query plan as it goes back through the steps. While this caching is useful for normal authoring, it means that you don't always get correct step comparison information because of later evaluations pulling on cached data.
Diagnostics schema
Id
When analyzing the results of a recording, it's important to filter the recording session by Id, so that columns such as Exclusive Duration % make sense.
Id is a composite identifier. It's formed of two numbers—one before the dot, and one after. The first number is the same for all evaluations that resulted from a single user action. In other words, if you press refresh twice, there are two different numbers leading the dot, one for each user activity taken. This numbering is sequential for a given diagnostics recording.
The second number represents an evaluation by the engine. This number is sequential for the lifetime of the process where the evaluation is queued. If you run multiple diagnostics recording sessions, this number continues to grow across the different sessions.
To summarize, if you start recording, press evaluation once, and stop recording, some number of Ids appear in your diagnostics. But since you only took one action, they're all 1.1, 1.2, 1.3, and so on.
The combination of the activityId and the evaluationId, separated by the dot, provides a unique identifier for an evaluation of a single recording session.
Query
The name of the Query in the left-hand pane of the Power Query editor.
Step
The name of the Step in the right-hand pane of the Power Query editor. Things like filter dropdowns generally associate with the step you filter on, even if you aren't refreshing the step.
Category
The category of the operation.
Data source kind
This data tells you what kind of data source you're accessing, such as SQL or Oracle.
Operation
The actual operation being performed. This operation can include evaluator work, opening connections, sending queries to the data source, and many more.
Start time
The time that the operation started.
End time
The time that the operation ended.
Exclusive duration (%)
The Exclusive Duration column of an event is the amount of time the event was active. This contrasts with the "duration" value that results from subtracting the values in an event's Start Time column and End Time column. This "duration" value represents the total time that elapsed between when an event began and when it ended, which might include times the event was in a suspended or inactive state and another event was consuming resources.
Exclusive duration % adds up to approximately 100% within a given evaluation, as represented by the Id column. For example, if you filter on rows with Id 1.x, the Exclusive Duration percentages would sum to approximately 100%. This isn't the case if you sum the Exclusive Duration % values of all rows in a given diagnostic table.
Exclusive duration
The absolute time, rather than %, of exclusive duration. The total duration (that is, exclusive duration + time when the event was inactive) of an evaluation can be calculated in one of two ways:
Find the operation called "Evaluation." The difference between End Time–Start Time results in the total duration of an event.
Subtract the minimum start time of all operations in an event from the maximum end time. In cases when the information collected for an event doesn't account for the total duration, an operation called "Trace Gaps" is generated to account for this time gap.
Resource
The resource you're accessing for data. The exact format of this resource depends on the data source.
Data source query
Power Query does something called folding, which is the act of running as many parts of the query against the back-end data source as possible. In DirectQuery mode (over Power Query), where enabled, only transforms that fold run. In import mode, transforms that can't fold are instead run locally.
The Data Source Query column shows the query or HTTP request and response that Power Query sends to the back-end data source. As you author your query in the editor, many Data Source Queries are emitted. Some of these queries are the actual final Data Source Query that renders the preview. But other queries might support data profiling, filter dropdowns, information on joins, or retrieving metadata for schemas.
In general, you shouldn't be concerned by the number of Data Source Queries emitted unless there are specific reasons to be concerned. Instead, you should focus on making sure the proper content is being retrieved. This column might also help determine if the Power Query evaluation was fully folded.
Additional info
There's a lot of information retrieved by our connectors. Much of it's ragged and doesn't fit well into a standard column hierarchy. This information is put in a record in the additional info column. Information logged from custom connectors also appears here.
Row count
The number of rows returned by a Data Source Query. Not enabled on all connectors.
Content length
Content length returned by HTTP Requests, as commonly defined. This schema isn't enabled in all connectors, and it isn't accurate for connectors that retrieve requests in chunks.
Is user query
A Boolean value that indicates if it's a query authored by the user and present in the left-hand pane, or if it was generated by some other user action. Other user actions can include things such as filter selection or using the navigator in the get data experience.
Path
Path represents the relative route of the operation when viewed as part of an interval tree for all operations within a single evaluation. At the top (root) of the tree, there's a single operation called Evaluation with path "0." The start time of this evaluation corresponds to the start of this evaluation as a whole. The end time of this evaluation shows when the whole evaluation finished. This top-level operation has an exclusive duration of 0, as its only purpose is to serve as the root of the tree.
Further operations branch from the root. For example, an operation might have "0/1/5" as a path. This path would be understood as:
- 0: tree root
- 1: current operation's parent
- 5: index of current operation
Operation "0/1/5" might have a child node, in which case, the path has the form "0/1/5/8," with 8 representing the index of the child.
Group ID
Combining two (or more) operations don't occur if it leads to detail loss. The grouping is designed to approximate "commands" executed during the evaluation. In the detailed view, multiple operations share a Group Id, corresponding to the groups that are aggregated in the Summary view.
As with most columns, the group ID is only relevant within a specific evaluation, as filtered by the Id column.
Data privacy partitions schema
Id
Same as the ID for the other query diagnostics results. The integer part represents a single activity ID, while the fractional part represents a single evaluation.
Partition key
Corresponds to the Query/Step that's used as a firewall partition.
Firewall group
Categorization that explains why this partition has to be evaluated separately, including details on the privacy level of the partition.
Accessed resources
List of resource paths for all the resources accessed by this partition, and is in general uniquely identifying a data source.
Partition inputs
List of partition keys upon which the current partition depends (this list could be used to build a graph).
Expression
The expression that gets evaluated on top of the partition's query/step. In several cases, it coincides with the query/step.
Start time
Time when evaluation started for this partition.
End time
Time when evaluation ended for this partition.
Duration
A value derived from End Time minus Start Time.
Exclusive duration
If partitions are assumed to execute in a single thread, exclusive duration is the "real" duration that can be attributed to this partition.
Exclusive duration %
Exclusive duration as a percentage.
Diagnostics
This column only appears when the query diagnostics "Aggregated" or "Detailed" is also captured, allowing the user to correspond between the two diagnostics outputs.
Performance counters schema
When you run performance counters, every half second Power Query takes a snapshot of resource utilization. This snapshot isn't useful for very fast queries, but can be helpful for queries that use up a lot more resources.
% processor time
Percent of time spent by processors on the query. This percentage might reach above 100% because of multiple processors.
Total processor time
Total duration of processor time spent on the query.
IO data bytes per second
Throughput speed of data received from the data source, expressed in bytes per second.
Commit (bytes)
Amount of virtual memory reserved by the evaluation.
Working set (bytes)
Amount of memory reserved by the evaluation.