Note
Access to this page requires authorization. You can try signing in or changing directories.
Access to this page requires authorization. You can try changing directories.
This multi-part reference covers the setup and running of a standard suite of tests for Power Query connector developers. This reference is meant to be done sequentially to ensure that your environment is set up for testing your custom connector.
Note
This article covers testing using the Visual Studio Code Test Explorer. For the PowerShell utility method, see Power Query SDK test framework part 5b - Testing your extension connector with PowerShell.
So far, you completed the following steps:
- Set up the environment
- Uploaded the test data
- Downloaded the test suite
- Learned various file formats and their functionality
You're finally ready to start verifying your extension connector with the test suite. This section focuses on using the integrated Test Explorer in Visual Studio Code, which provides a rich UI for discovering, running, and debugging tests. Under the hood, this integration uses the Visual Studio Code Testing API and executes tests using the PQTest utility's run-compare command (see PQTest run-compare documentation).
In this section, you:
- Configure your workspace for the Test Explorer
- Create and configure the test settings file
- Discover and run tests using the UI
- View test results and compare outputs
Prerequisites
To use the Test Explorer integration, ensure you have the following prerequisites:
Visual Studio Code: Version 1.100 or later.
Power Query SDK Extension: Ensure the Power Query SDK extension is installed and updated to version 0.7.0 or later. Your connector project is recognized by the Power Query SDK as indicated by the Power Query SDK section in the Explorer pane displaying the project tasks.
Configuration
To enable the Test Explorer to find and run your tests, you need to configure one or more specific test settings files and your Visual Studio Code workspace settings.
1. Test Settings File (.testsettings.json)
The .testsettings.json file drives the test discovery. This file is functionally identical to the settings file (.settings) introduced in the test format specification, but uses the .testsettings.json extension for explicit identification by the Test Explorer.
You can create a new .testsettings.json file, or migrate an existing settings file by renaming it to use the .testsettings.json extension. Place the file in your project (for example, in your Settings folder) with the necessary configuration.
Important: Paths specified within the .testsettings.json file (such as QueryFilePath, DiagnosticsPath, etc.) are expected to be relative to the location of the settings file itself.
Example .testsettings.json:
{
  "QueryFilePath": "../TestSuites/contoso.query.pq",
  "ParameterQueryFilePath": "../ParameterQueries/contoso.parameterquery.pq",
  "DiagnosticsPath": "../Diagnostics",
  "FailOnMissingOutputFile": true
}
2. Configure the Extension
You need to configure the Power Query SDK with the location of your test settings, your connector extension file, and the PQTest utility.
Open your settings in Visual Studio Code.
- Workspace Settings (for project-specific paths): Open the Command Palette (Ctrl+Shift+P or Cmd+Shift+P), type Preferences: Open Workspace Settings (JSON) and select it.
- User Settings (for global paths): Open the Command Palette, type Preferences: Open User Settings (JSON) and select it.
Add the following configurations:
powerquery.sdk.tools.location: The absolute path to the PQTest installation folder (containingPQTest.exe). This setting can be defined in either User or Workspace settings.- Example:
"C:\\Users\\<username>\\.vscode\\extensions\\powerquery.vscode-powerquery-sdk-<version>\\.nuget\\Microsoft.PowerQuery.SdkTools.<version>\\tools"
- Example:
powerquery.sdk.test.settingsFiles: The list of test settings files to discover. Accepts a single file path, a directory path (to discover all.testsettings.jsonfiles inside), or an array of file/directory paths. (Workspace setting)powerquery.sdk.test.ExtensionPaths: The list of connector extension (.mez) files to test. Accepts a single file path or an array of paths. If not provided, the SDK usespowerquery.sdk.defaultExtension(which supports a single path). (Workspace setting)
Example .vscode/settings.json:
{
  "powerquery.sdk.tools.location": "C:\\Users\\<username>\\.vscode\\extensions\\powerquery.vscode-powerquery-sdk-0.7.0-win32-x64\\.nuget\\Microsoft.PowerQuery.SdkTools.2.150.3\\tools",
  "powerquery.sdk.test.settingsFiles": [
    "${workspaceFolder}/Tests/Settings/MyConnector.testsettings.json"
  ],
  "powerquery.sdk.test.ExtensionPaths": [
    "${workspaceFolder}/bin/AnyCPU/Debug/MyConnector.mez"
  ]
}
Tip
You can use variables like ${workspaceFolder} to make paths relative to your project root. Relative paths in settings.json are resolved relative to the workspace root.
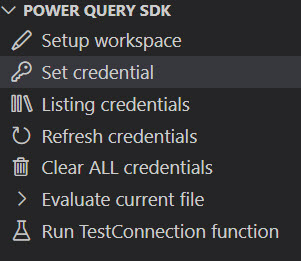
3. Configure Credentials
If your connector requires authentication, you must store valid credentials before running tests. The Power Query SDK provides a task to manage credentials directly from the Visual Studio Code UI.
For detailed instructions, refer to the Set credential section in the Power Query SDK overview.
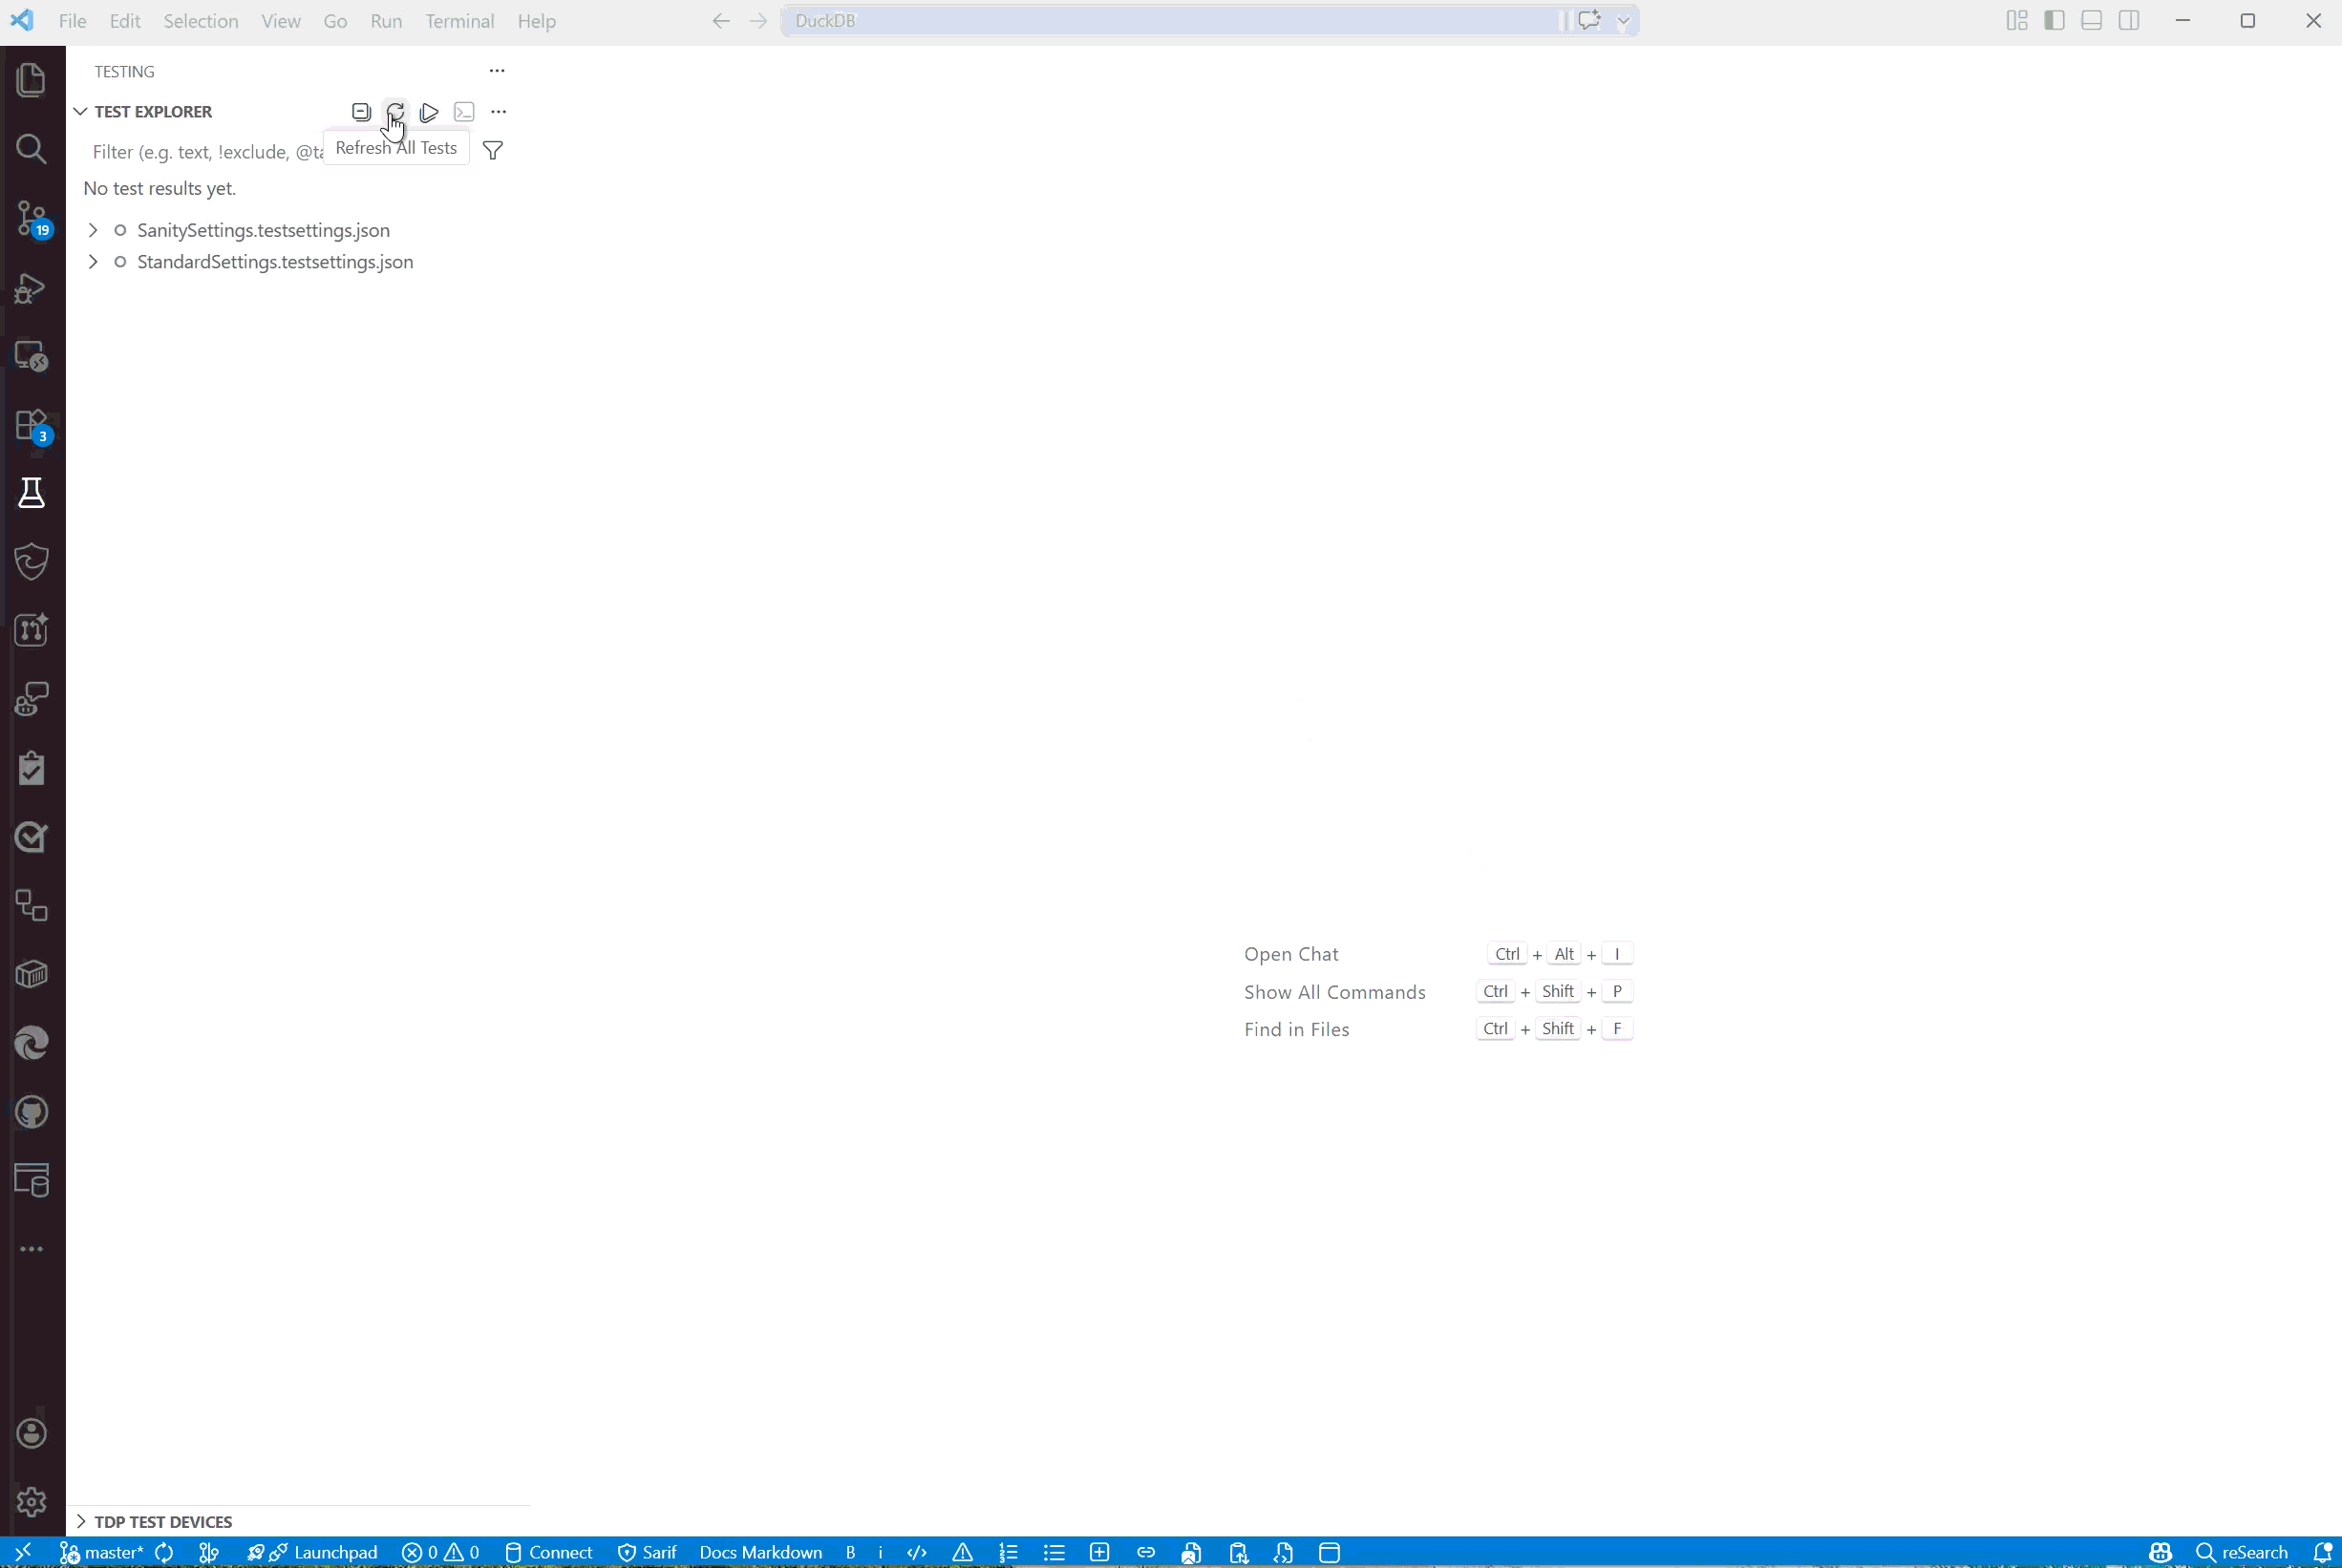
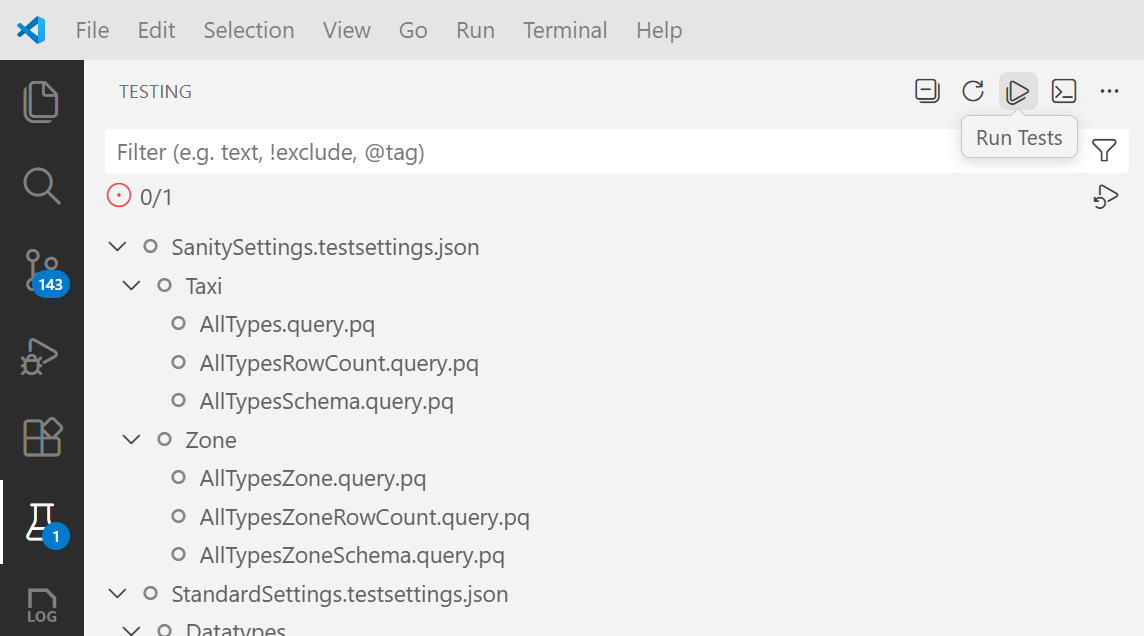
Test Discovery
Once configured, you can discover your tests in the Test Explorer view.
Open the Testing view in Visual Studio Code (Select the beaker icon in the Activity Bar).
You should see your test settings files listed.
Expand the nodes to see the discovered tests. The hierarchy mirrors your folder structure.
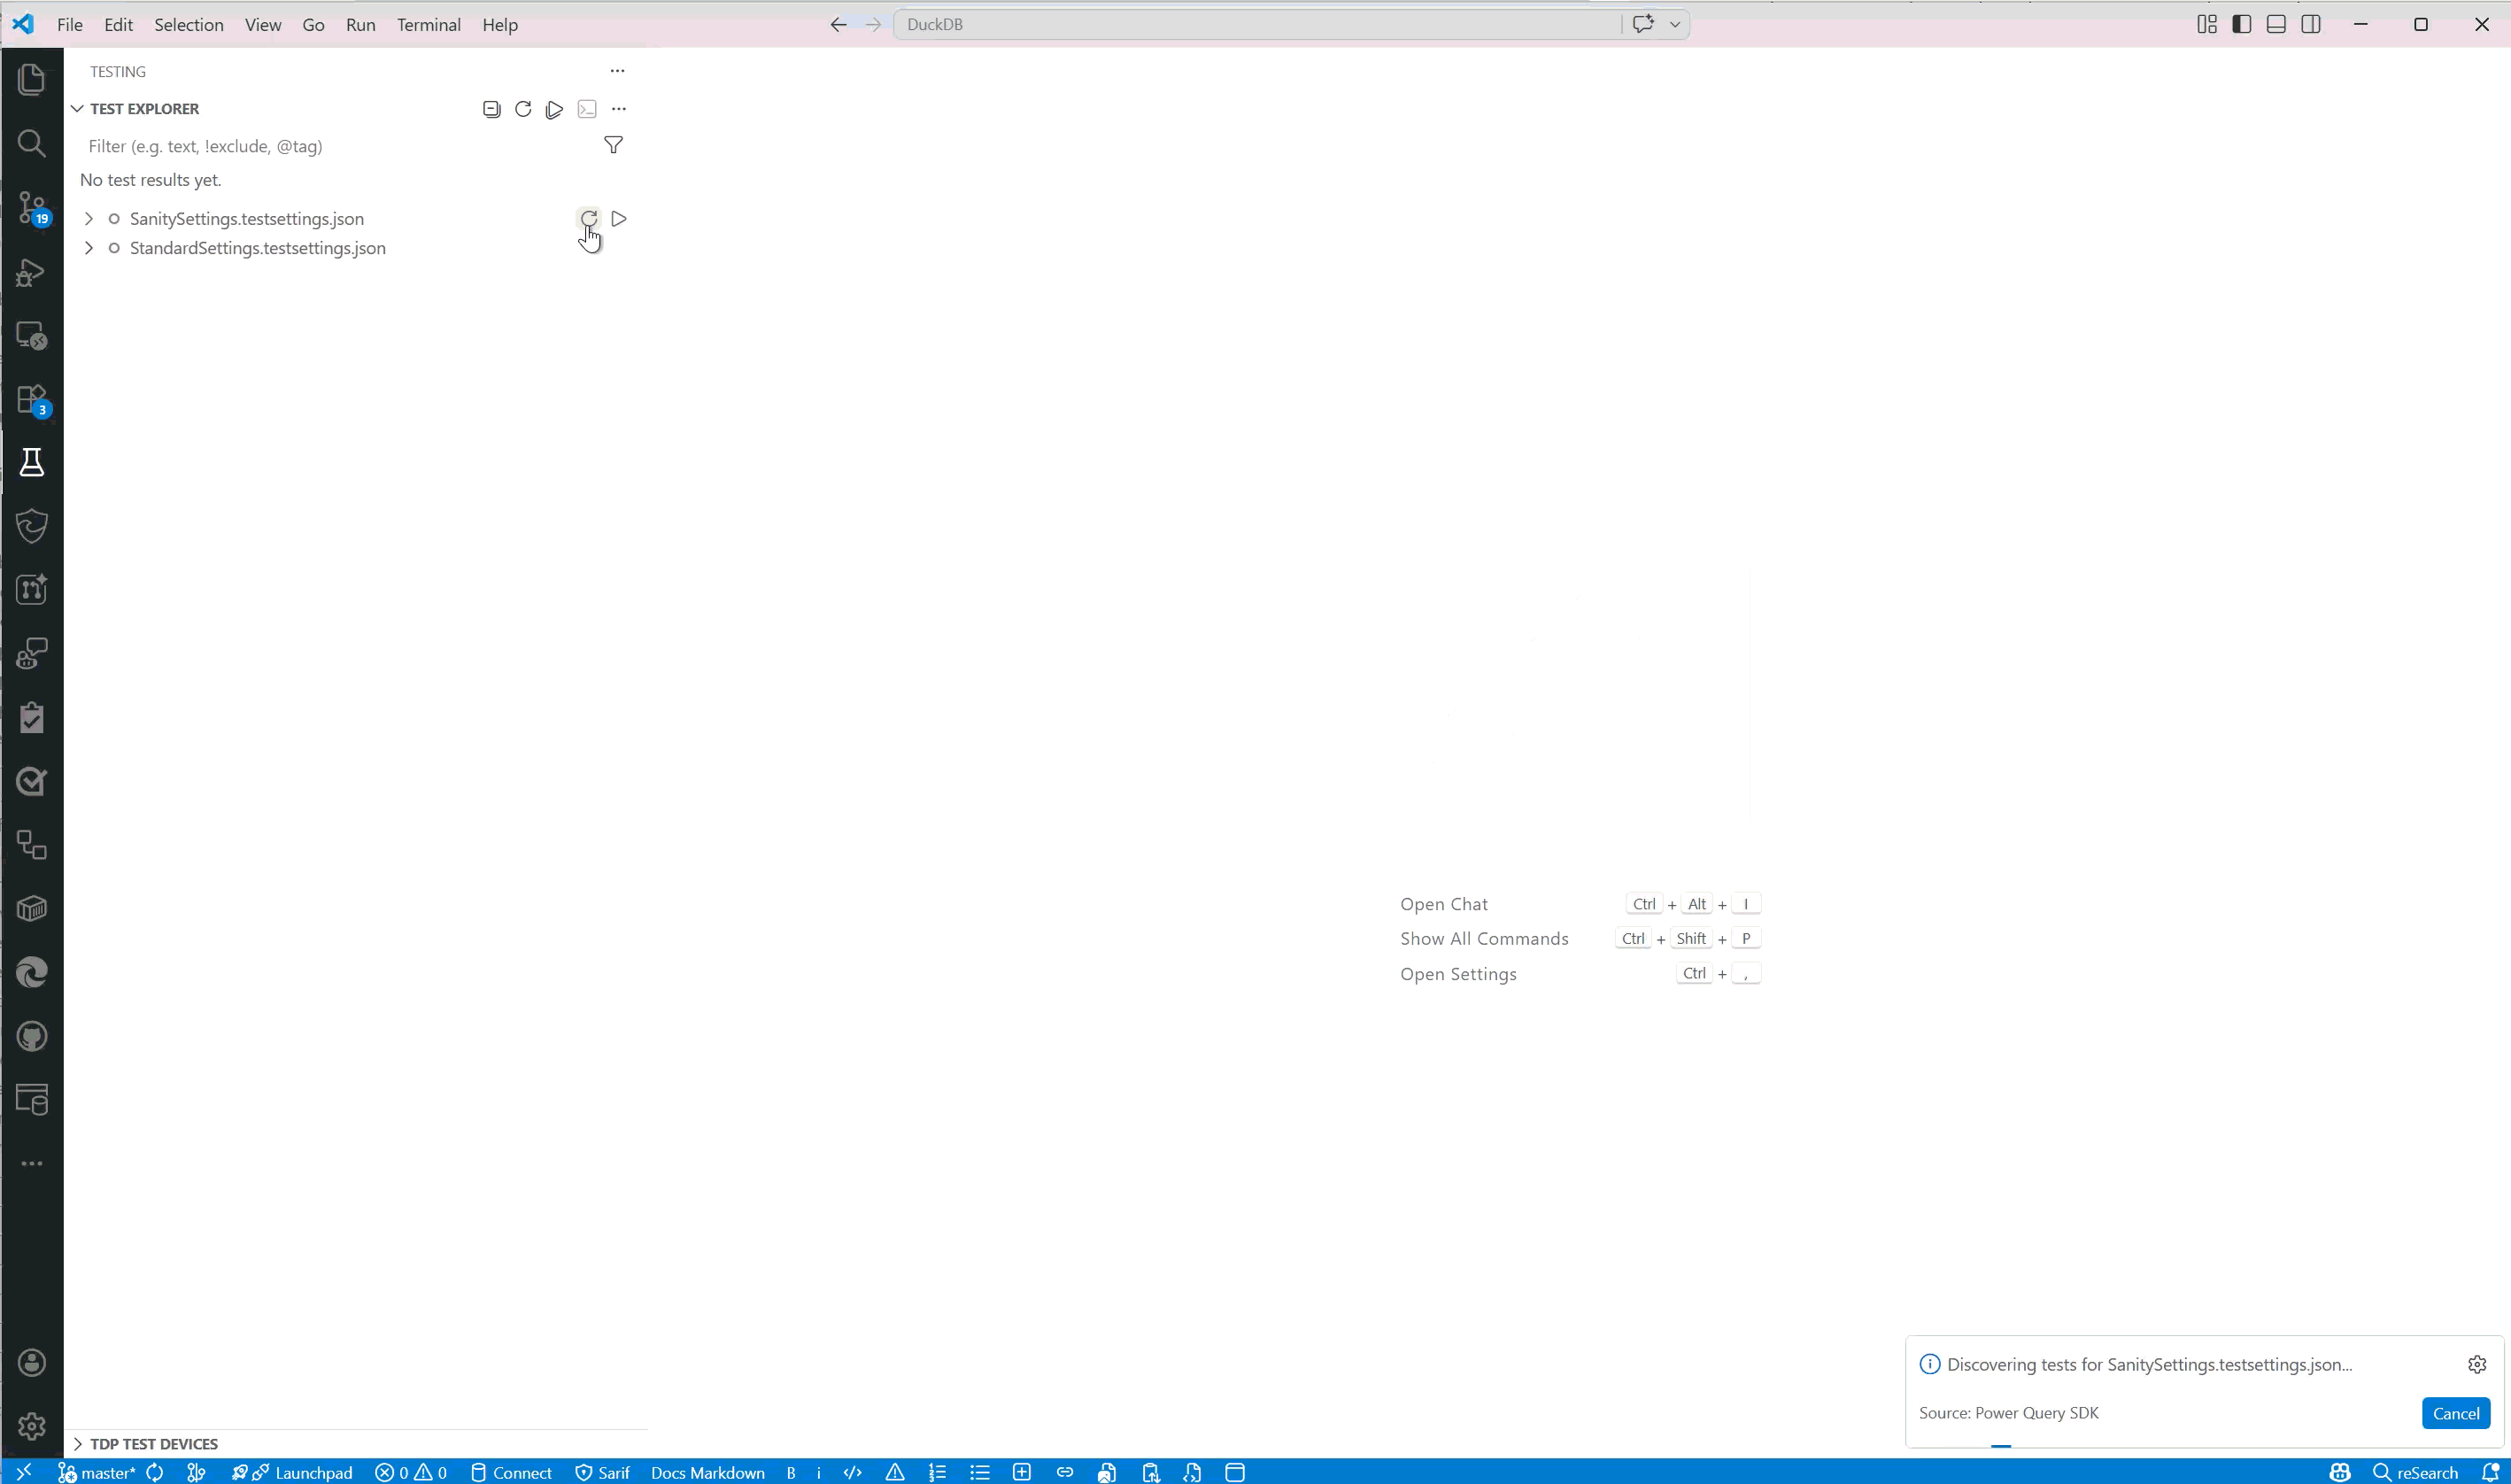
Refreshing Tests
If you add new tests, change the settings or test discovery fails for some reason, you can refresh the discovery:
Refresh All Tests: Select the Refresh All Tests button (circular arrow icon) at the top of the Test Explorer pane to rediscover tests for all settings files.
Refresh Tests referred by a Test Settings file: Hover over a specific test settings file and select the Refresh Tests button (circular arrow icon) to rediscover tests for just that file.
Running Tests
You can run tests at various levels of granularity directly from the UI:
Run All: Select the Run Tests (play icon) at the top of the pane.
Run Group/Folder: Hover over a folder or settings item and select the Run Test button.
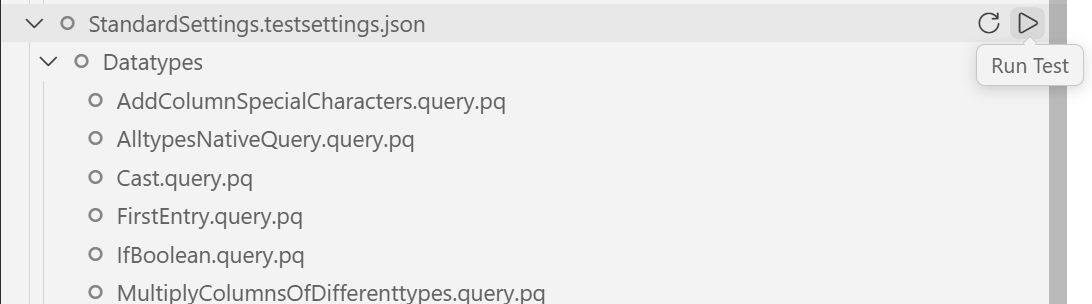
Run Individual Test: Hover over a specific test item and select the Run Test button.
Note
If you run a settings item that isn't yet discovered, the extension automatically discovers the tests before running them.
As tests run, the status icons update in real-time to show progress (running, passed, or failed).
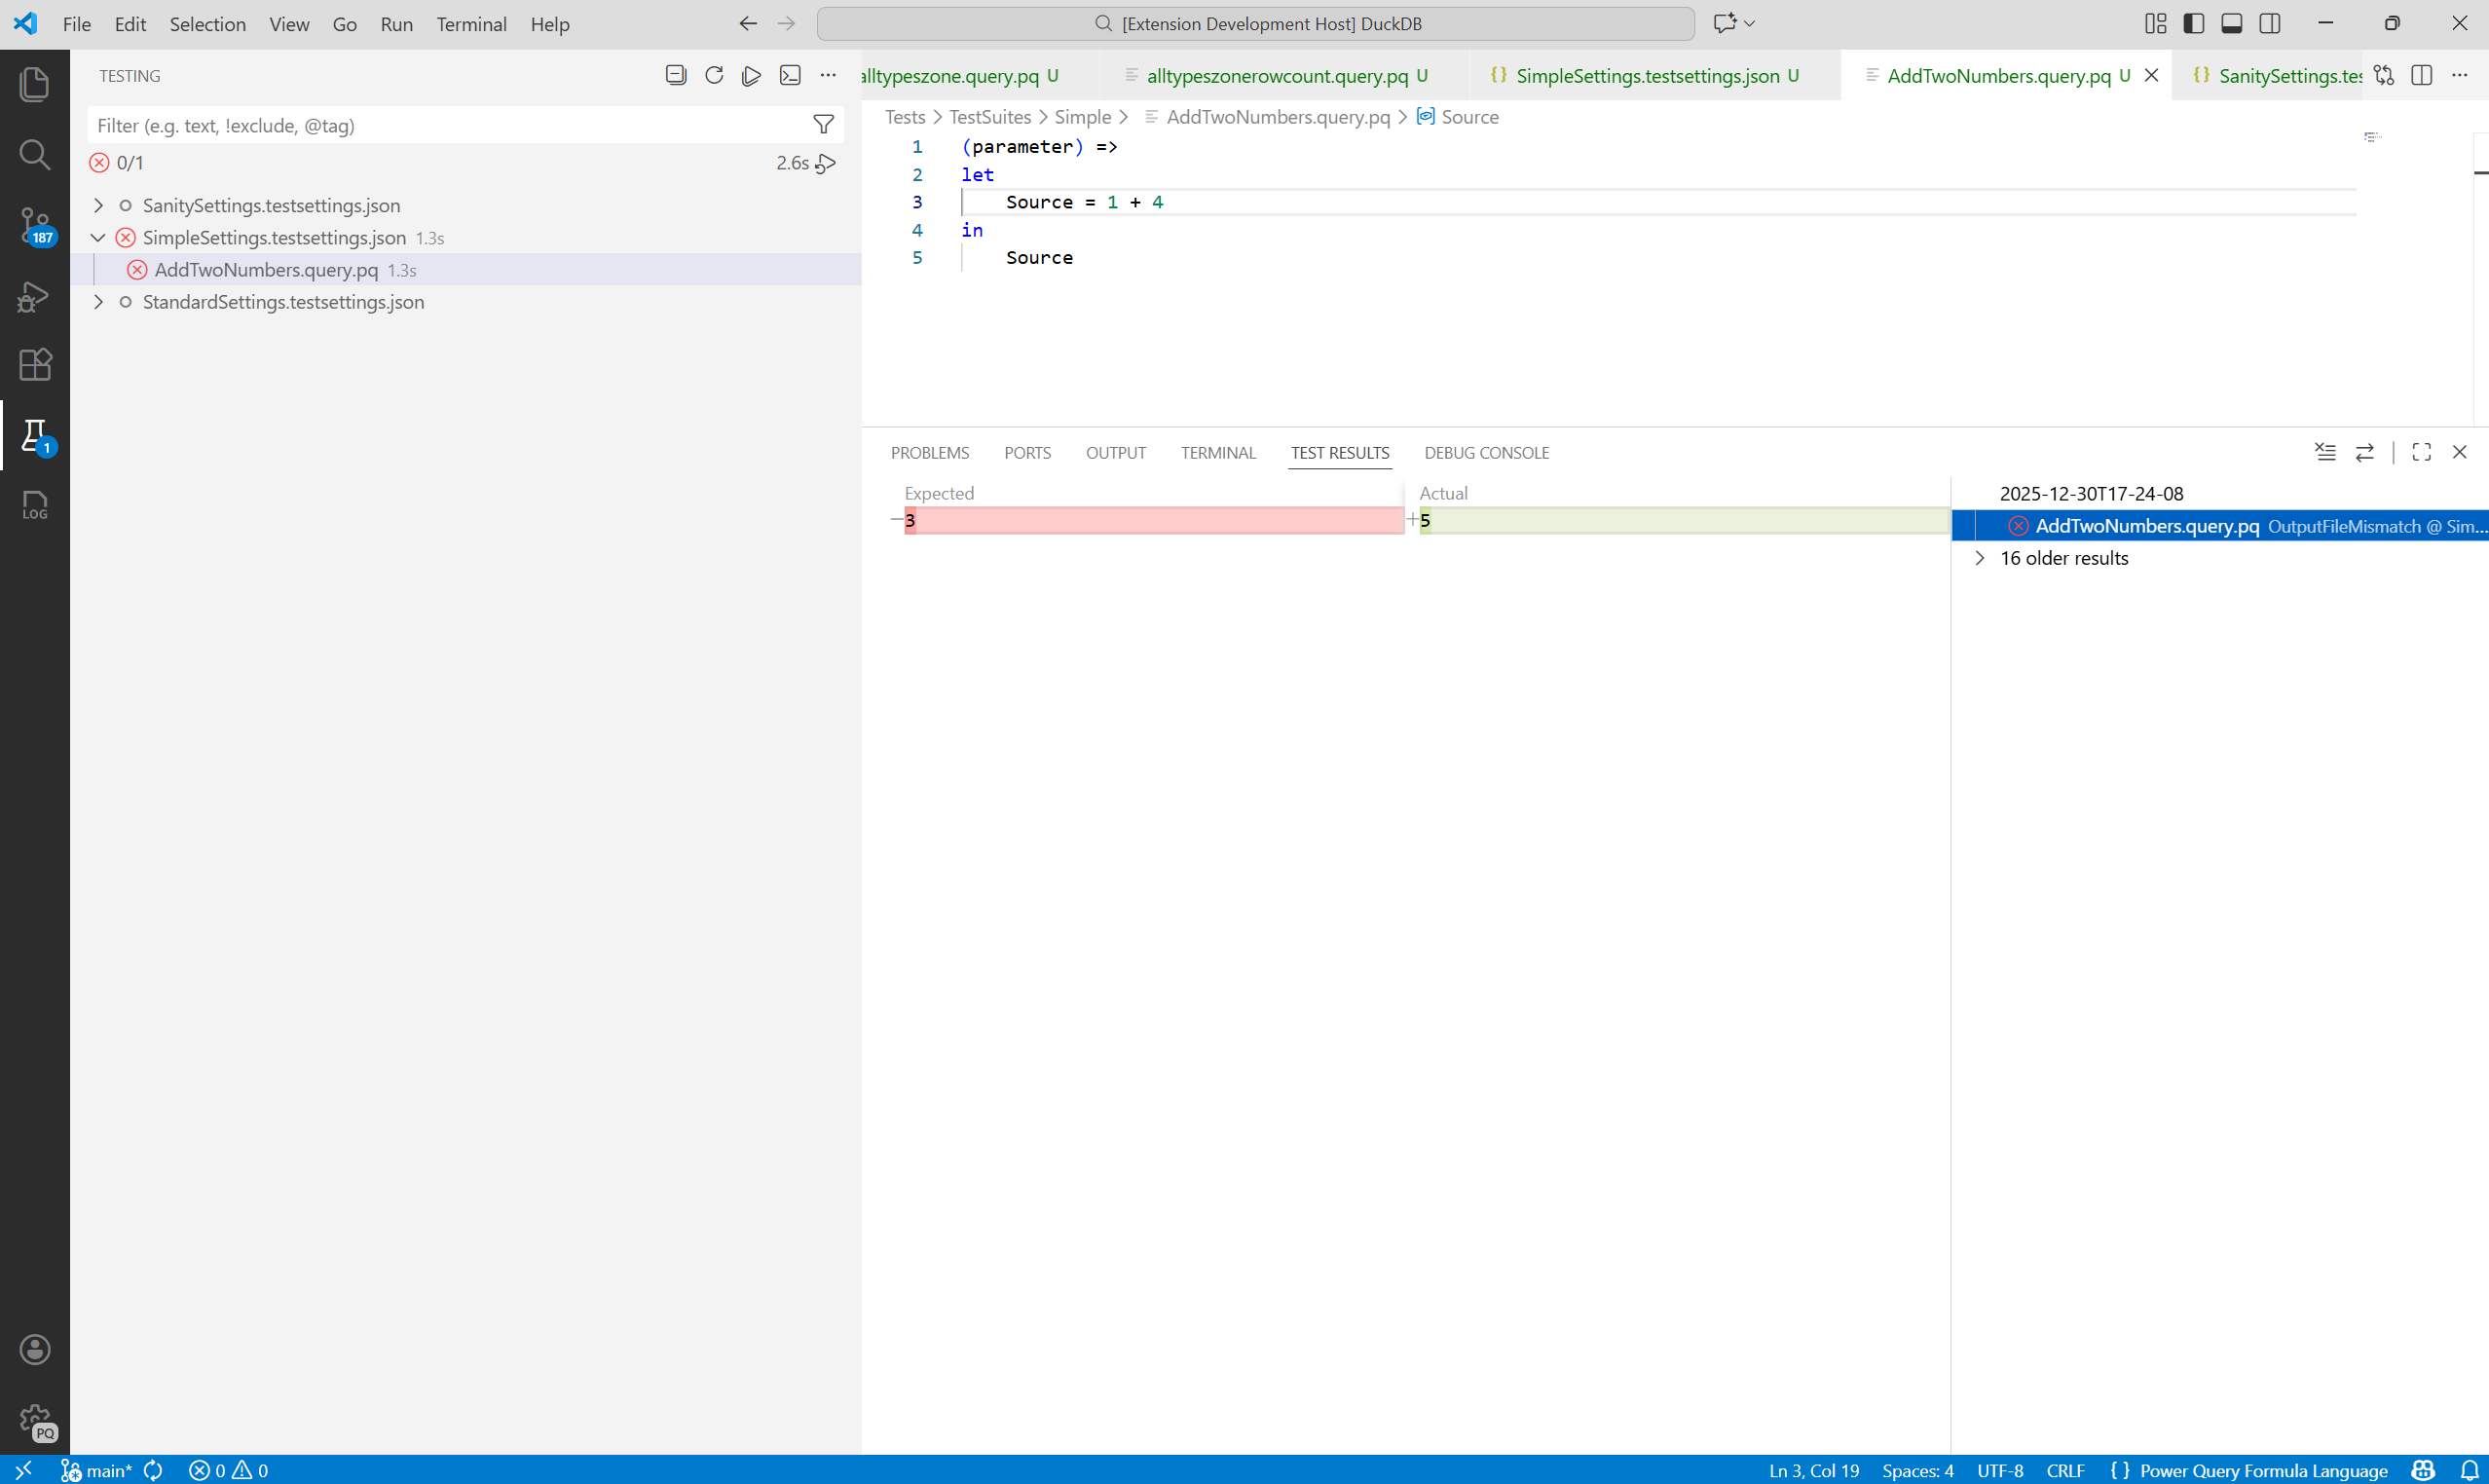
Viewing Results and Debugging
The Test Results pane (located in the bottom panel by default) displays the raw test results from PQTest or any error messages. It also lists the last run history, showing passed and failed tests.
Diff View for Failures
If a test fails because the output didn't match the expected result, the Test Explorer provides a built-in diff view. Select the failure in the Test Results pane to see a side-by-side comparison of the Actual vs. Expected output.
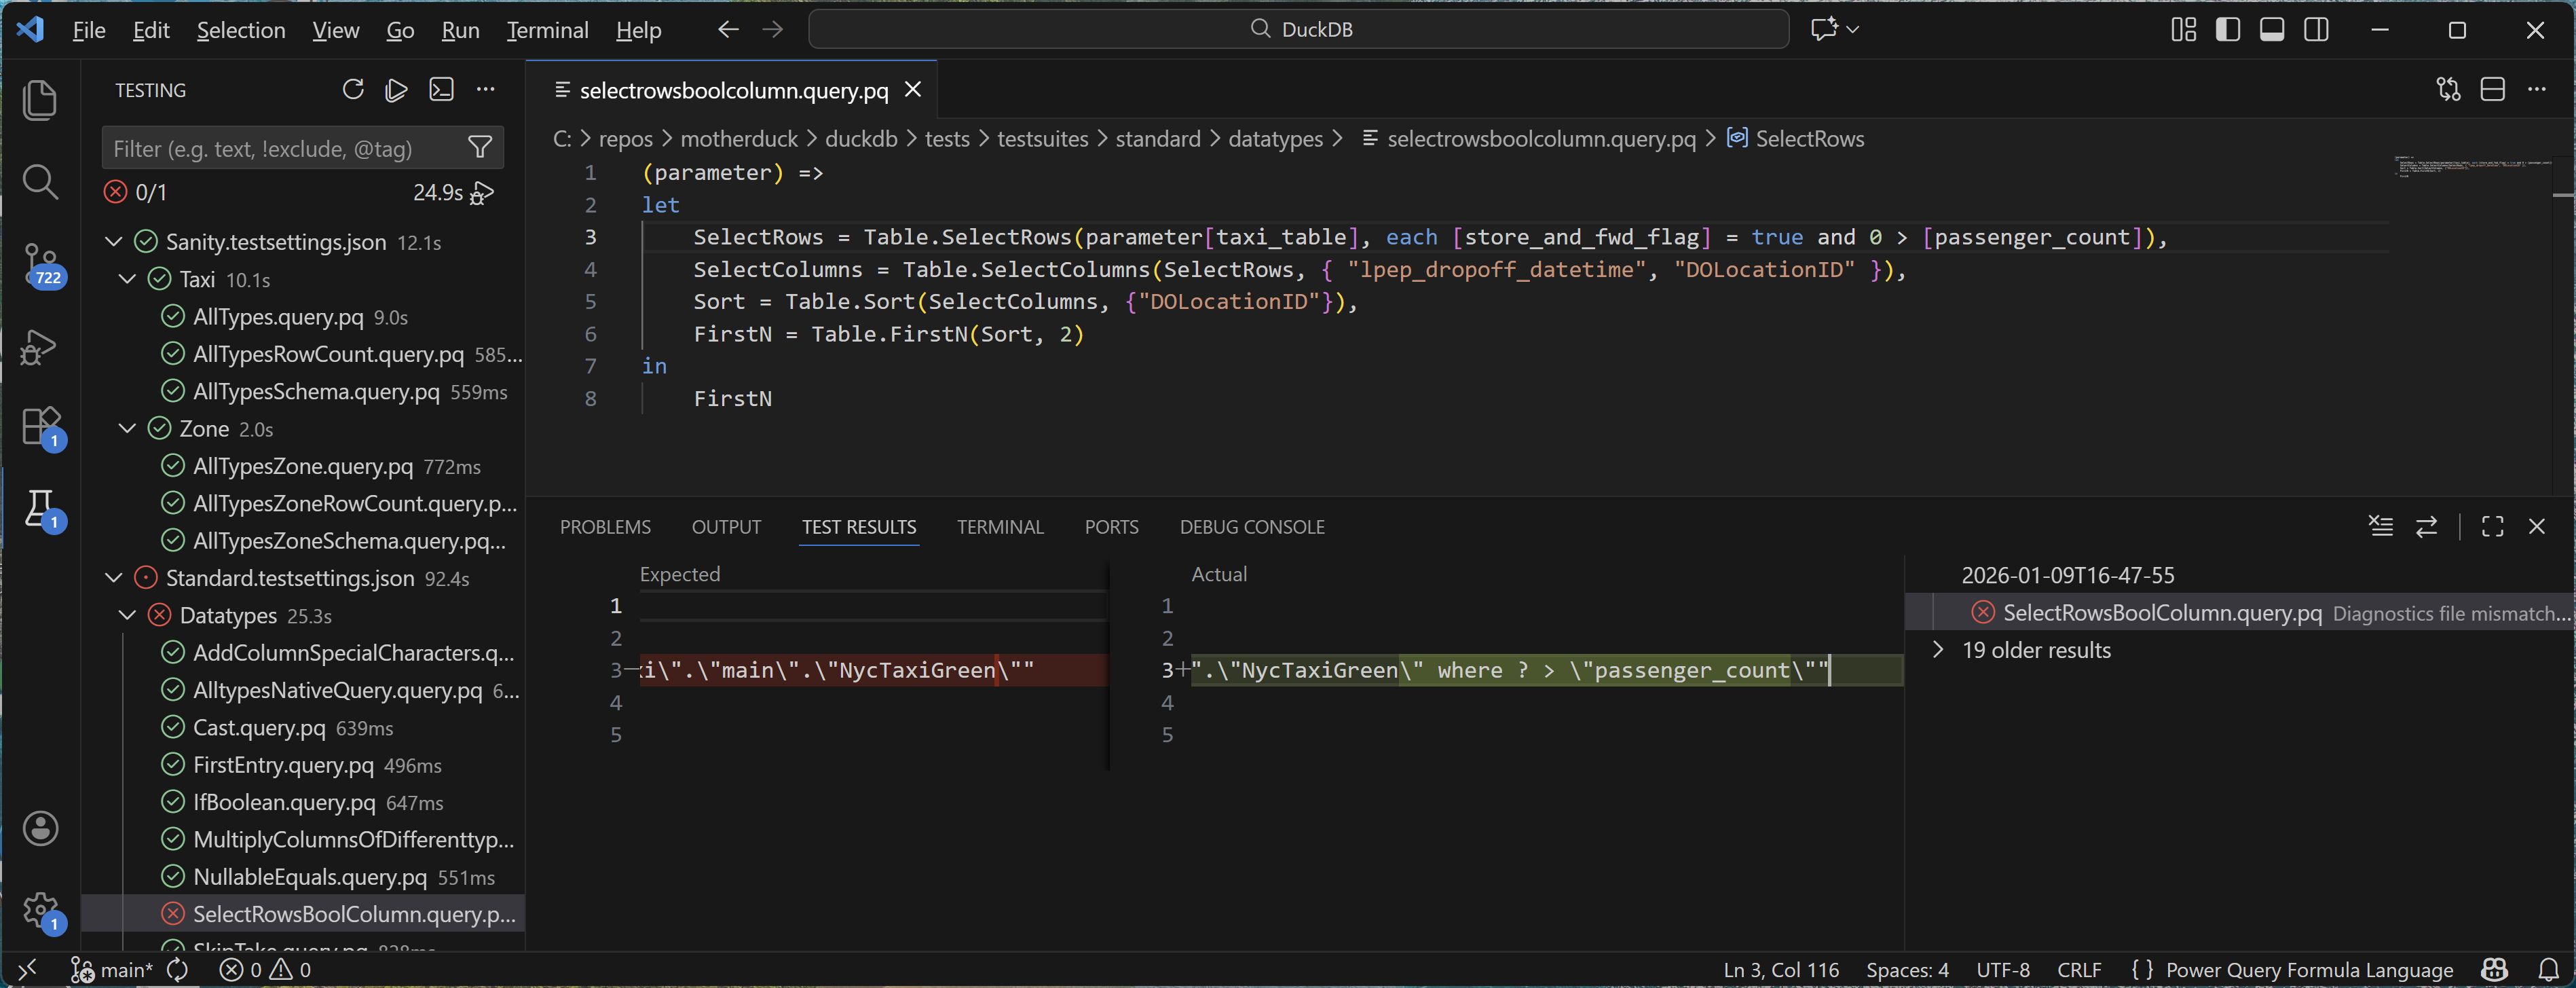
Query Folding Diagnostics
If your test configuration enables query folding validation (by specifying a DiagnosticsPath), the extension also compares the generated diagnostics against the expected baseline.
If a test fails due to a diagnostics mismatch, you can view the diff between the Actual and Expected diagnostics files by selecting the failure in the Test Results pane.
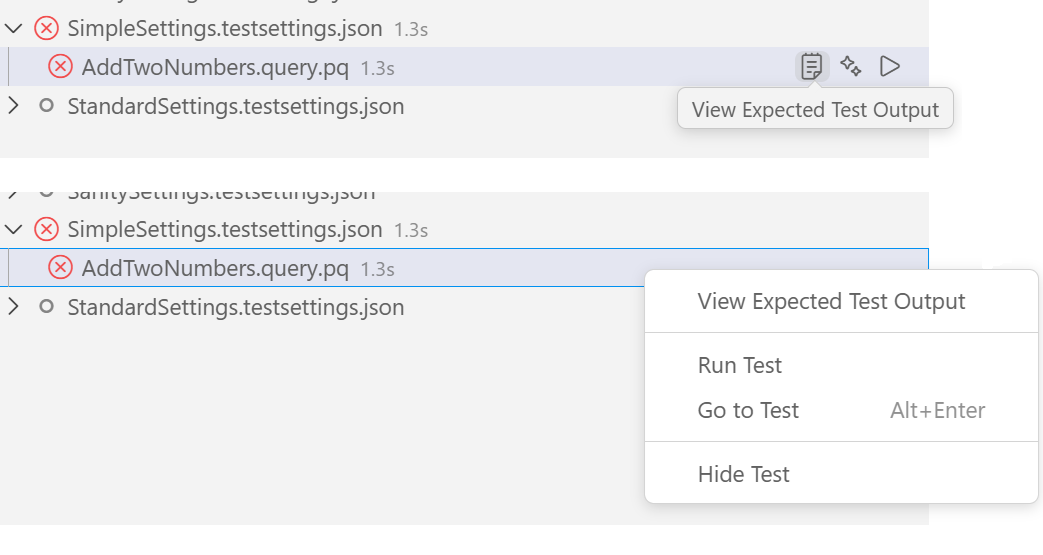
View Expected Output
You can quickly view the expected output file (.pqout) for any test. Either select the View Expected Test Output icon (clipboard) that appears when hovering over a test, or right-click the test item and select View Expected Test Output from the context menu. This action opens the corresponding .pqout file in the editor.
Troubleshooting
If you encounter issues, check the Power Query SDK output channel for logs. It can help you verify the PQTest run-compare command being executed and identify any unexpected behavior.
Common Issues
- PQTest.exe not found: Ensure the
powerquery.sdk.tools.locationsetting points to the correct absolute path of the PQTest installation folder. - Invalid QueryFilePath or No tests discovered: Verify that the paths in your test settings file are correct.
QueryFilePathshould point to a valid.query.pqfile or a directory containing them. Remember that relative paths in.testsettings.jsonare relative to the settings file itself. - Expanding a settings file does nothing: If expanding a node in the Test Explorer doesn't show any tests, try using the Refresh Tests command (refresh icon inline with the settings item) to trigger discovery again.
Conclusion
This section showed you how to use the Visual Studio Code Test Explorer to efficiently discover, run, and debug your connector tests. This UI-driven approach offers a streamlined alternative to the command-line tools.
In the next section, you learn how to add your own custom tests to the framework.