Note
Access to this page requires authorization. You can try signing in or changing directories.
Access to this page requires authorization. You can try changing directories.
This guide shows you how to interactively debug C# source code for a compiled PowerShell module using Visual Studio Code (VS Code) and the C# extension.
Some familiarity with the Visual Studio Code debugger is assumed.
For a general introduction to the VS Code debugger, see Debugging in Visual Studio Code.
For examples of debugging PowerShell script files and modules, see Using Visual Studio Code for remote editing and debugging.
This guide assumes you have read and followed the instructions in the Writing Portable Modules guide.
Creating a build task
Build your project automatically before launching a debugging session. Rebuilding ensures that you debug the latest version of your code.
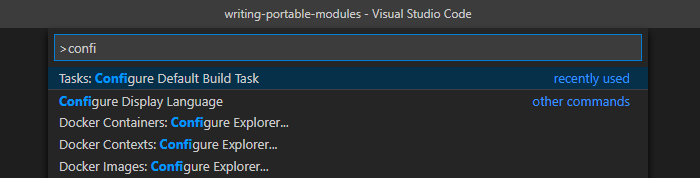
Configure a build task:
In the Command Palette, run the Configure Default Build Task command.
In the Select a task to configure dialog, choose Create tasks.json file from template.
In the Select a Task Template dialog, choose .NET Core.
A new tasks.json file is created if one doesn't exist yet.
To test your build task:
In the Command Palette, run the Run Build Task command.
In the Select the build task to run dialog, choose build.
Information about DLL files being locked
By default, a successful build doesn't show output in the terminal pane. If you see output that
contains the text Project file doesn't exist, you should edit the tasks.json file. Include the
explicit path to the C# project expressed as "${workspaceFolder}/myModule". In this example,
myModule is the name of the project folder. This entry must go after the build entry in the
args list as follows:
    {
        "label": "build",
        "command": "dotnet",
        "type": "shell",
        "args": [
            "build",
            "${workspaceFolder}/myModule",
            // Ask dotnet build to generate full paths for file names.
            "/property:GenerateFullPaths=true",
            // Do not generate summary otherwise it leads to duplicate errors in Problems panel
            "/consoleloggerparameters:NoSummary",
        ],
        "group": "build",
        "presentation": {
            "reveal": "silent"
        },
        "problemMatcher": "$msCompile"
    }
When debugging, your module DLL is imported into the PowerShell session in the VS Code terminal. The DLL becomes locked. The following message is displayed when you run the build task without closing the terminal session:
Could not copy "obj\Debug\netstandard2.0\myModule.dll" to "bin\Debug\netstandard2.0\myModule.dll"`.
Terminal sessions must be closed before you rebuild.
Setting up the debugger
To debug the PowerShell cmdlet, you need to set up a custom launch configuration. This configuration is used to:
- Build your source code
- Start PowerShell with your module loaded
- Leave PowerShell open in the terminal pane
When you invoke your cmdlet in the terminal session, the debugger stops at any breakpoints set in your source code.
Configuring launch.json for PowerShell
Install the C# for Visual Studio Code extension
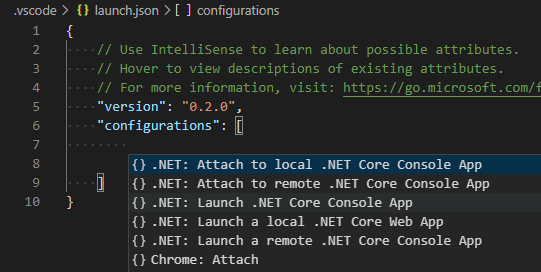
In the Debug pane, add a debug configuration
In the
Select environmentdialog, choose.NET CoreThe
launch.jsonfile is opened in the editor. With your cursor inside theconfigurationsarray, you see theconfigurationpicker. If you don't see this list, select Add Configuration.To create a default debug configuration, select Launch .NET Core Console App:
Edit the
name,program,args, andconsolefields as follows:{ "name": "PowerShell cmdlets: pwsh", "type": "coreclr", "request": "launch", "preLaunchTask": "build", "program": "pwsh", "args": [ "-NoExit", "-NoProfile", "-Command", "Import-Module ${workspaceFolder}/myModule/bin/Debug/netstandard2.0/myModule.dll", ], "cwd": "${workspaceFolder}", "stopAtEntry": false, "console": "integratedTerminal" }
The program field is used to launch pwsh so that the cmdlet being debugged can be run. The
-NoExit argument prevents the PowerShell session from exiting as soon as the module is imported.
The path in the Import-Module argument is the default build output path when you've followed the
Writing Portable Modules guide. If you've created a module manifest (.psd1 file), you should
use the path to that instead. The / path separator works on Windows, Linux, and macOS. You must
use the integrated terminal to run the PowerShell commands you want to debug.
Note
If the debugger doesn't stop at any breakpoints, look in the Visual Studio Code Debug Console for a line that says:
Loaded '/path/to/myModule.dll'. Skipped loading symbols. Module is optimized and the debugger option 'Just My Code' is enabled.
If you see this, add "justMyCode": false to your launch config (at the same level as
"console": "integratedTerminal".
Configuring launch.json for Windows PowerShell
This launch configuration works for testing your cmdlets in Windows PowerShell (powershell.exe).
Create a second launch configuration with the following changes:
nameshould bePowerShell cmdlets: powershelltypeshould beclrprogramshould bepowershellIt should look like this:
 {
     "name": "PowerShell cmdlets: powershell",
     "type": "clr",
     "request": "launch",
     "preLaunchTask": "build",
     "program": "powershell",
     "args": [
         "-NoExit",
         "-NoProfile",
         "-Command",
         "Import-Module ${workspaceFolder}/myModule/bin/Debug/netstandard2.0/myModule.dll",
     ],
     "cwd": "${workspaceFolder}",
     "stopAtEntry": false,
     "console": "integratedTerminal"
 }
Launching a debugging session
Now everything is ready to begin debugging.
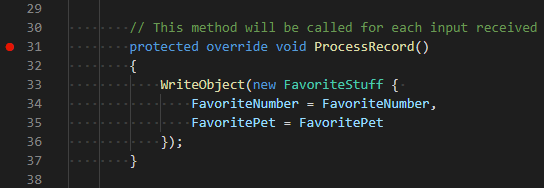
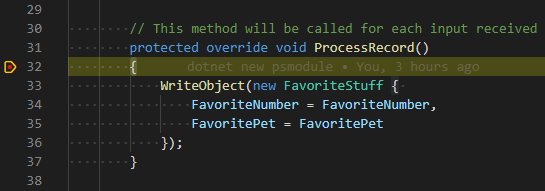
Place a breakpoint in the source code for the cmdlet you want to debug:
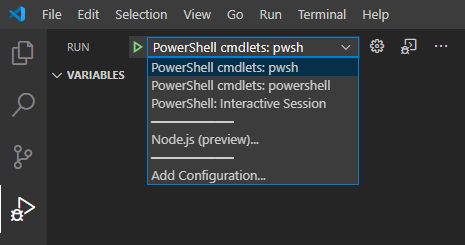
Ensure that the relevant PowerShell cmdlets configuration is selected in the configuration drop-down menu in the Debug view:
Press F5 or click on the Start Debugging button
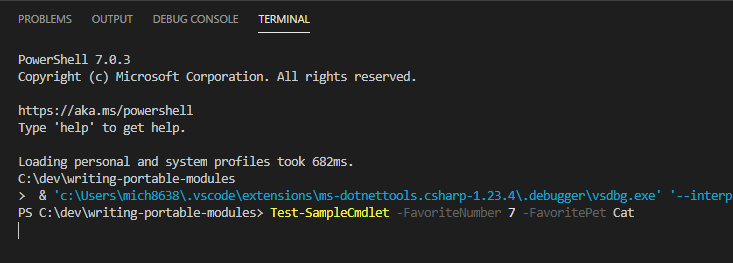
Switch to the terminal pane and invoke your cmdlet:
Execution stops at the breakpoint:
You can step through the source code, inspect variables, and inspect the call stack.
To end debugging, click Stop in the debug toolbar or press Shift+F5. The shell used for debugging exits and releases the lock on the compiled DLL file.
Collaborate with us on GitHub
The source for this content can be found on GitHub, where you can also create and review issues and pull requests. For more information, see our contributor guide.