Create a people counting solution with Azure Percept Vision
Important
Retirement of Azure Percept DK:
Update 22 February 2023: A firmware update for the Percept DK Vision and Audio accessory components (also known as Vision and Audio SOM) is now available here, and will enable the accessory components to continue functioning beyond the retirement date.
The Azure Percept public preview will be evolving to support new edge device platforms and developer experiences. As part of this evolution the Azure Percept DK and Audio Accessory and associated supporting Azure services for the Percept DK will be retired March 30th, 2023.
Effective March 30th, 2023, the Azure Percept DK and Audio Accessory will no longer be supported by any Azure services including Azure Percept Studio, OS updates, containers updates, view web stream, and Custom Vision integration. Microsoft will no longer provide customer success support and any associated supporting services. For more information, please visit the Retirement Notice Blog Post.
This guide will focus on detecting and counting people using the Azure Percept DK hardware, Azure IoT Hub, Azure Stream Analytics, and Power BI dashboard.
The tutorial is intended to show detailed steps on how users can create, configure, and implement the basic components of this solution. Users can easily expand the tutorial and create additional ways to visualize people counting data.
Top customer scenarios:
- People counting intelligence: aggregation of people counting over a given day, week, or duration.
- Occupancy: determine when a space is free and available for use. Quantify how long the space is idle and unused.
- Understanding peak occupancy levels and when they occur.
- Detecting people counting after hours: count of people in space during non-business hours.
In this tutorial, you learn how to:
- Set up your Azure Percept DK and Vision AI model
- Create a Container Registry resource
- Build and push your edge solution to Container Registry
- Deploy edge solution to device
- Add a consumer group to your IoT Hub
- Create a Stream Analytics Job
- Create and publish a Power BI report to visualize data
Solution architecture

Input : Video stream from Azure Percept DK
Output: Count of people in Power BI dashboard

Azure Subscription: (Free trial account)
Power BI subscription: (Try Power BI for free)
Power BI workspace: (Create the new workspaces in Power BI)
Azure Percept DK setup experience: you connected your devkit to a Wi-Fi network, created an IoT Hub, and connected your devkit to the IoT Hub
Download and install VS Code
Download and install Git
Install the IoT Hub Extension in VS Code
Install the Azure IoT Tools Extension in VS Code
Download and install Docker Desktop (Will require a PC reboot)
(Only for Windows Users) Install WSL2 by running the following commands in Windows PowerShell or Terminal (on macOS) (Will require a PC restart)
wsl --installwsl --set-default-version 2
Step 0: Set up your Azure Percept DK and Vision AI model
Setting up the Azure Percept DK is the first step in the tutorial. Below are the steps to follow and links to further guidance.
Follow Quickstart: unbox and assemble your Azure Percept DK components and the next steps.
Connect the camera module to the Azure Percept DK via the USB-C cable.
Open Command Prompt (for Windows) or Terminal (on macOS) and execute the command-
git clone https://github.com/microsoft/Azure-Percept-Reference-Solutions.gitWithin the cloned repository go to
people-counting-with-azure-percept-visiondirectory.
Step 1: Create a Container Registry resource
Azure Container Registry is a managed, private Docker registry service based on the open-souce Docker Registry. Container Registries are used to manage and store your private Docker containers images and related artifacts.
Login to Azure portal https://portal.azure.com/
To create a Container Registry, go to Create container registry - Microsoft Azure
a. Select your Azure Subscription in the
Subscriptiondrop-down boxb. Select your preferred resource group from the
Resource groupdrop-down menu. It is recommended to use theResource groupwhich contains the IOT Hub connected to the Azure Percept DK.c. Provide a unique
Registry Named. Under
Location, select the region to deploy resource (We suggest selectWest US)e.
Availability Zones- disabledf. For
SKU, selectStandardg. Keep all other tab as default and click
Review + createat the bottom of the screen. Once the validation passes, clickCreate. This will create your Container Registry.
After successful resource deployment go to your container registry resource. On the left scroll panel select
Access KeysunderSettingsandenabletheAdmin user
Make a note of the
Login Server,Username, andpassword
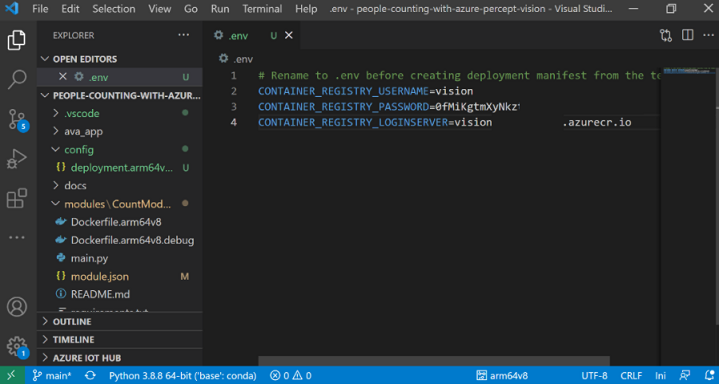
Go to the git repository and
people-counting-with-azure-percept-visiondirectory and renameenvtemplateto.env. Open the file and fill in the following details-a. CONTAINER_REGISTRY_USERNAME= your container registry Username
b. CONTAINER_REGISTRY_PASSWORD= your container registry Password
c. CONTAINER_REGISTRY_LOGINSERVER= your container registry Login Server
Step 2: Build and push your edge solution to Container Registry
This section guides users on modifying the cloned people counting repo with their individual deployment information, building the model image, and pushing model image to container registry.
Open VS Code, at the bottom of the screen ensure you have
arm64v8as theDefault Platform for IoT Edge Solutionselected (if not, then please click and select arm64v8 from the list)
Within the
people-counting-with-azure-percept-visiondirectory go tomodules/CountModule/directory and openmodule.json. Fill in yourContainer registry address(same as theLogin serversaved earlier) and followed by arepository name(Note- please make sure your repository name is all lowercase)"repository": "<Your container registry login server/repository name>"will change as follows, for example-
"repository": "visiontrainingacr.azurecr.io/countmodule"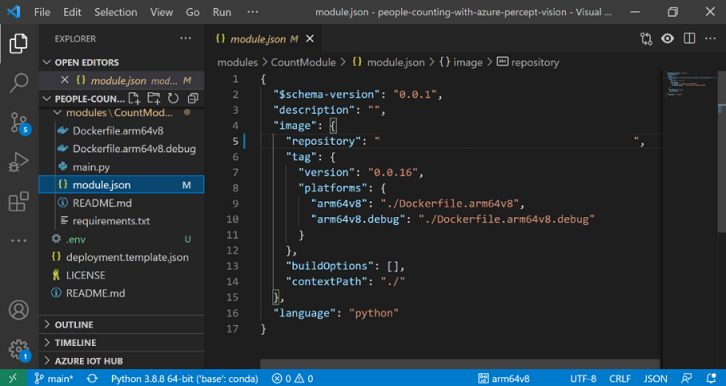
Now you will build the module image and push it to your container registry. Open Visual Studio Code integrated terminal by selecting
View > TerminalSign into Docker with the Azure Container registry (ACR) credentials that you saved after creating the registry using below command in terminal. Note that this command would give a warning that using --password or -p via CLI is insecure. Therefore, if you want a more secure login for your future solution development, use
--password-stdininstead by following this instruction.docker login -u <ACR username> -p <ACR password> <ACR login server>Visual Studio Code now has access to your container registry. In the next steps you will turn the solution code into a container image. In Visual Studio Code explorer, right click the
deployment.template.jsonfile and selectBuild and Push IoT Edge Solution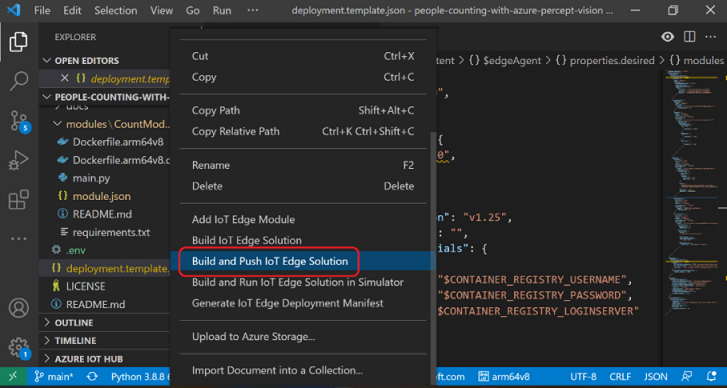
The build and push command starts three operations. First, it creates a new folder in the solution called
configthat holds the full deployment manifest, built out of information in the deployment template and other solution files. Second, it runsdocker buildto build the container image based on the appropriate docker file for your target architecture. Then, it runsdocker pushto push the image repository to your container registry. This process may take several minutes the first time but is faster the next time that you run the commands.Open the
deployment.arm64v8.jsonfile in the newly created config folder. The filename reflects the target architecture, so it will be different if you choose a different architecture.Notice that the two parameters that had placeholders now are filled in with their proper values. The
registryCredentialssection has your registry username and password pulled from the .env file. TheCountModulehas the full image repository with thename,version, andarchitecturetag from themodule.jsonfile.To further verify what the build and push command did, go to the Azure portal, and navigate to your container registry. In your container registry, select
Repositoriesthencountmodule
Step 3: Deploy edge solution to device
Step 3 will guide users on creating and deploying a manifest to the Azure Percept Dev Kit. This deployment will create a new edge module ‘CountModule’ and will overwrite any previous deployments of ‘CountModule’.
In the Visual Studio Code explorer, under the
Azure IoT Hubsection, expandDevicesto see your list of IoT devicesRight-click the IoT Edge device that you want to deploy to, then select
Create Deployment for Single Device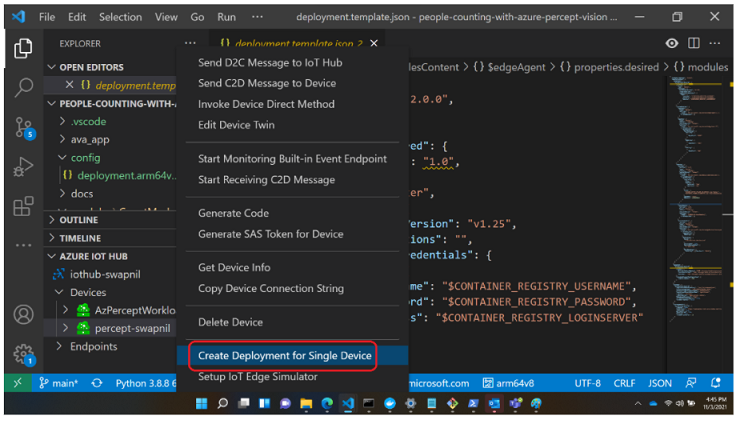
In the file explorer, navigate into the
configfolder then select thedeployment.arm64v8.jsonfile and clickSelect Edge Deployment Manifest.Do not use the deployment.template.json file, which does not have the container registry credentials or module image values in it.
Under your device, expand
Modulesto see a list of deployed and running modules. Click the refresh button. You should see theCountModulerunning on your device.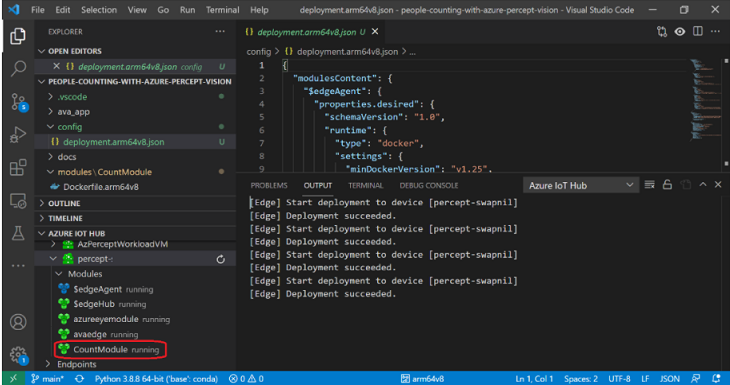
Go to Azure Percept Studio and on the left panel, select Devices, then select your Azure Percept device

Ensure that your device is
Connected. Click onVision
Click
View your device stream
The previous step will deploy modules to your device. In the
Notificationstab clickView Stream. This will open a new tab in your browser, please verify that you see the video stream. If you point the camera module to a person then you will see the person detection with bounding box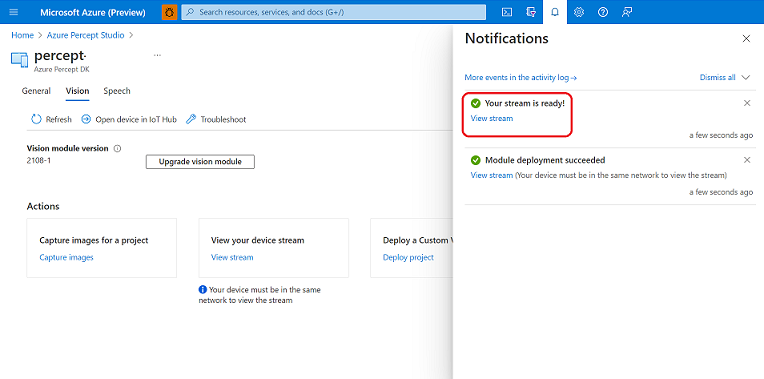
After verifying the video stream and bounding boxes, please close the web stream browser tab.
To ensure the Count Module is setup correctly, in the Azure portal go to your IoT Hub. On the left panel under
Device managementselectIoT Edge
From the IoT device list click on your Azure Percept DK device

Scroll down to check if all deployed modules are in
runningstatus
Click
Troubleshoot
From the drop-down list select
CountModule
Ensure you see
People_Countlogs as follows-
Step 4: Add a consumer group to your IoT Hub
Consumer Groups provide independent views into the event stream that enable apps and Azure services to independently consume data. This consumer group will be used by the Stream Analytics Job we will create in Step 5.
In the Azure portal, go to your IoT hub which is connected to your Azure Percept DK.
On the left pane, select
Hub settings > Built-in endpoints. Enter a name for your new consumer group in the text box underConsumer Groups
Click anywhere outside the text box to save the consumer group
Step 5: Create a Stream Analytics job
Step 5 guides users through creating, configuring, and running a Stream Analytics job. Stream Analytics is a hot path to stream data from out Azure IoT Hub to a Power BI workspace in real time. We will create a query so only People Counting telemetry will be streamed. Once People Counting data is in our Power BI workspace it will be easy to render with a Power BI report.
Go to New Stream Analytics job - Microsoft Azure
Enter the following information for the job -
Job name- The name of the job. The name must be globally unique.Resource group- Use the same resource group that your IoT hub uses.Location- Use the same location as your resource group.

Click
Create
Add an input to the Stream Analytics job
Open the previously created Stream Analytics job. Under
Job topology, selectInputsIn the
Inputspane, selectAdd stream input, then selectIoT Hubfrom the drop-down list.
On the new input pane, enter the following information -
Input alias- Enter a unique alias for the inputSelect IoT Hub from your subscription- Select this radio buttonSubscription- Select the Azure subscription you are using for this labIoT Hub- Select the IoT Hub you are using for this labConsumer group- Select the consumer group you created previouslyShared access policy name- Select the name of the shared access policy you want the Stream Analytics job to use for your IoT hub. For this lab, you can select serviceShared access policy key- This field is auto filled based on your selection for the shared access policy nameEndpoint- Select Messaging
Leave all other fields as default-

Click
Save
Add an output to the Stream Analytics job
Create a Group Workspace, take the following steps to create one -
a. In a new web browser tab open Power BI
b. On the left panel click on
Workspaces > Create a workspacec. Give your workspace a name and description (optional) and click
Saved. Go back to the Azure portal and go to the Stream Analytics job
Under
Job topology, selectOutputsIn the
Outputspane, selectAdd, and then selectPower BIfrom the drop-down list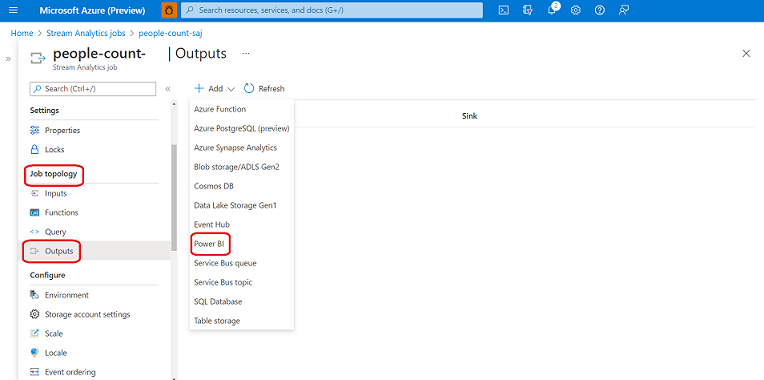
Enter the following information-
Output alias- A unique alias for the outputSelect Group workspace from your subscriptions- Select this radio buttonGroup workspace- Select your target group workspaceDataset name- Enter a dataset nameTable name- Enter a table nameAuthentication mode- User token

On the
Power BI - New outputpane, selectAuthorizeand follow the prompts to sign into your Power BI accountClick
Save
Configure the query of the Stream Analytics job
Under
Job topology, selectQueryReplace
[YourInputAlias]with the input alias of the jobReplace
[YourOutputAlias]with the output alias of the jobAdd the following
WHEREclause as the last line of the query. This line ensures that only messages with aPeople_Countproperty will be forwarded to Power BI.WHERE People_Count IS NOT NULLThe query will look as follows -

Click
Save QueryNote- The
People_Countproperty is sent from thecountmoduleto the IoT hub and is forwarded to the Stream Analytics job.
Run the Stream Analytics job
In the Stream Analytics job, select
Overview, then selectStart > Now > Start
Once the job successfully starts, the job status changes from
StoppedtoRunning
Step 6: Create and publish a Power BI report to visualize data
This step will guide users on how to create a Power BI report from the People Counting telemetry data. The tutorial walks through initial steps to visualize people counting data. Users who are interested to learn more ways to transform, aggregate, and visualize their data could explore the Power BI product page for ideas and templates.
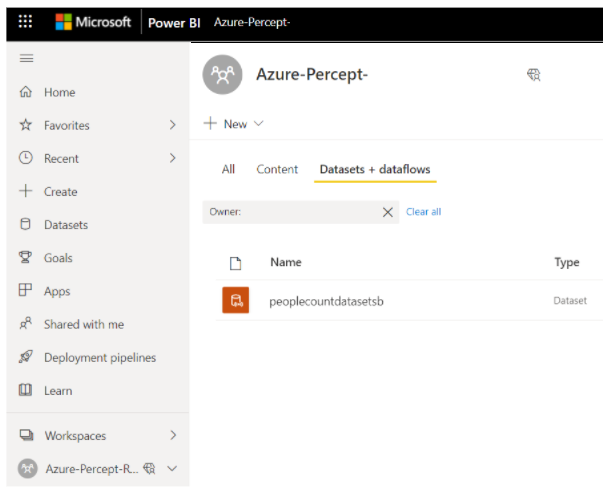
Login to Power BI and select your Workspace (this is the same Group Workspace you used while creating the Stream Analytics job output)
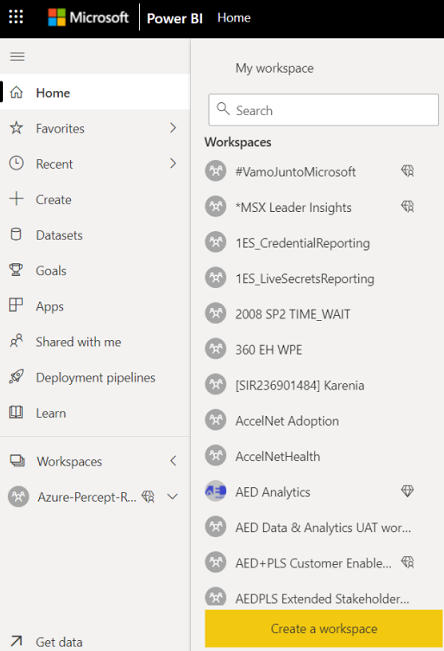
Verify that you see your dataset
On the left scroll panel select
+ Createand then clickPick a published dataset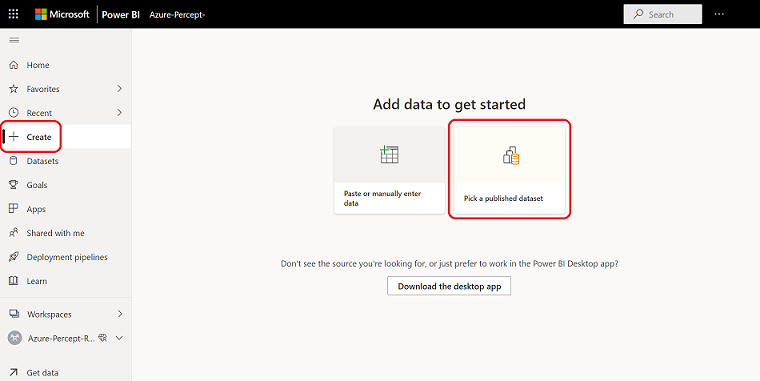
Select your dataset and click
CreateOn the right, expand the
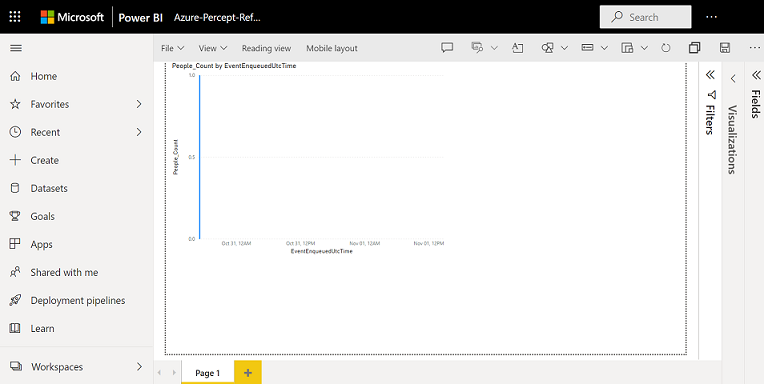
Fieldsdropdown and selectEventEnqueuedUtcTimeandΣPeople_CountUnder
VisualizationsselectLine and clustered column chart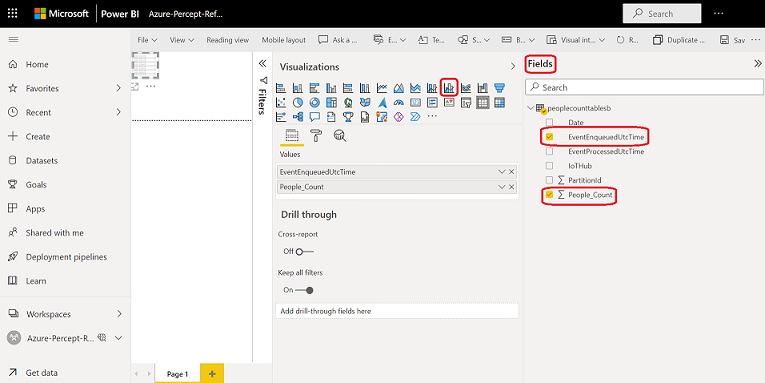
This will generate a graph as follows-
Click
Refreshperiodically to update the graph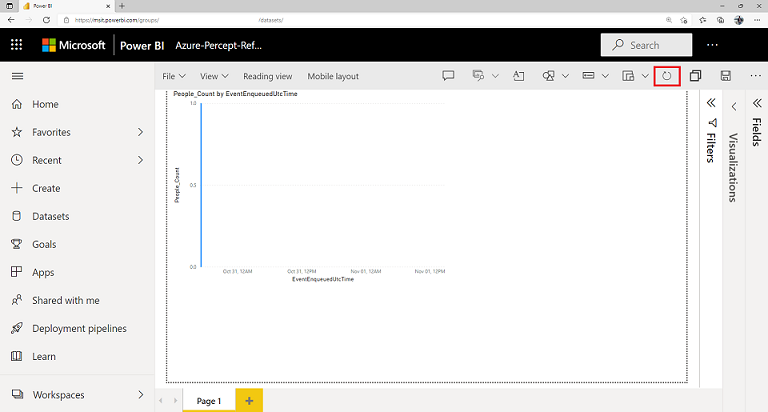
Step 7: Clean up resources
If you're not going to continue to use this application, delete Azure resources with the following steps:
Login to the Azure portal, go to
Resource Groupyou have been using for this tutorial. Select theStream Analytics Jobresource created and stop the job from running then delete.Login to Power BI and select your Workspace (this is the same Group Workspace you used while creating the Stream Analytics job output), and delete workspace.
Next steps
Check out the other tutorial under Advanced prototyping with Azure Percept section for your Azure Percept DK.