Forecast your product backlog
TFS 2018
Teams use the forecast tool to help in their sprint planning efforts. By plugging in a value for the team velocity, the forecast tool shows which items in the backlog can be completed within future sprints. Both tools are team-specific tools that rely on the team's ability to estimate backlog items. Once your team has completed a sprint or two, they can use the team velocity to forecast how much of the backlog they can finish within the upcoming sprints.
Use this article to learn:
- How to forecast upcoming sprints
- Required and recommended team activities to support forecasting
Note
For more information, see Backlogs, boards, and plans. In case you're not seeing the desired work items on your backlog or board, see Set up your backlogs and boards to configure them according to your preferences.
Prerequisites
- Connect to a project. If you don't have a project yet, create one.
- You must be added to a project as a member of the Contributors security group. If you're not on a project or team, get added now.
- You must be granted Basic access or higher to add or modify work items. For more information, see About access levels.
Required and recommended activities
Here's what you need to have in place before you attempt to forecast your team's backlog.
Required:
- Define iteration paths (sprints) and configure team iterations
- Sprints should be of the same duration.
- Select enough future sprints to forecast your entire product backlog.
- Define and estimate backlog items. If you work from your team's backlog, the items you create automatically get assigned to the current sprint (Iteration) and to your team's default Area Path.
- Update the status of backlog items once work starts and when completed. Only backlog items whose State maps to a state category of Proposed or In Progress show up on the velocity chart. (For more information, see Workflow states and state categories).
Recommended:
- Define and size backlog items to minimize variability.
- Determine how your team wants to treat bugs. If your team chooses to treat bugs like requirements, bugs appear on the backlog and be counted within the Velocity chart and forecasting.
- Set your team's area path. The forecast tool forecasts those items based on your team's default settings. These settings can specify to include items in area paths under the team's default or exclude them.
- Don't create a hierarchy of backlog items and bugs. The display of the leaf node, the last node in a same-category hierarchy, may only appear on Kanban boards, sprint backlogs, and Taskboards. For more information, see Fix reordering and nesting issues, How backlogs and boards display hierarchical (nested) items.
Instead of nesting requirements, bugs, and tasks, maintain a flat list—only creating parent-child links one level deep between different-category items. Use Features to group requirements or user stories. You can quickly map stories to features. The map creates parent-child links in the background. - At the end of the sprint, update the status of those backlog items that the team has fully completed. Incomplete items should be moved back to the product backlog and considered in a future sprint planning meeting.
Note
If you work with several teams, and each team wants to work with their own backlog, velocity chart, and forecast tool, you can create additional teams. Each team then gets access to their own set of Agile tools. Each Agile tool filters work items to only include those whose assigned area paths and iteration paths meet those set for the team.
Forecast upcoming sprints
Use the forecast tool to get an idea of how many items you can complete within a sprint. By plugging in a velocity, you can see which items are within scope for the set of sprints the team has activated.
To forecast your product backlog, complete the following actions.
To forecast your product backlog, complete the following actions.
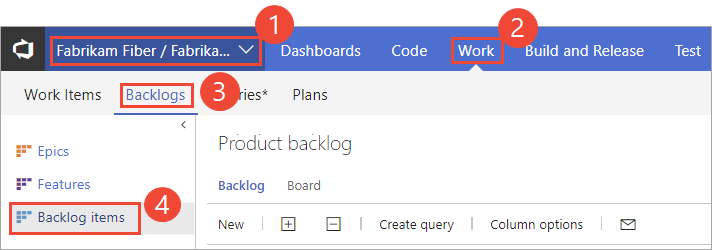
From your web browser, open your team's product backlog. (1) Select the team from the project/team selector, choose (2) Work, (3) Backlogs, and then (4) the product backlog, which is Backlog items (for Scrum), Stories (for Agile), or Requirements (for CMMI).
You can only forecast the product backlog of Stories, Backlog items, or Requirements.
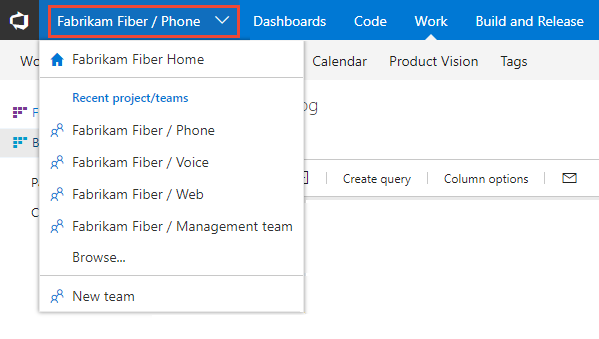
To choose another team, open the project/team selector and select a different team or choose the Browse option.
Note
If you work with several teams, and each team wants to work with their own backlog, velocity chart, and forecast tool, you can create additional teams. Each team then gets access to their own set of Agile tools. Each Agile tool filters work items to only include those whose assigned area paths and iteration paths meet those set for the team.
(Optional) To choose which columns should display and in what order, choose Column options. You may want to add the Iteration Path to the set of columns that appear on your backlog. For more information, see Change column options.
Set Forecast to On and enter your team's predicted velocity. If the Forecasting bar doesn't appear, set Parents to Hide.
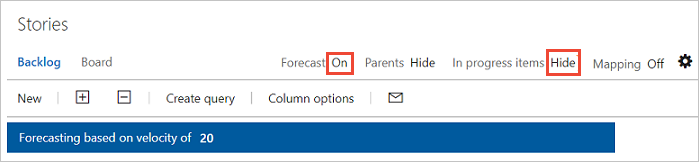
Set In progress items to Hide to hide those items that won't be counted in the forecast. The forecast tool ignores Scrum items set to Committed or Done and Agile and CMMI items set to Active, Resolved, or Completed.
The tool draws lines for each future sprint selected by the team. The Forecast lines show how much work your team can complete in future sprints. Typically, items above the first line are already in progress for the current sprint. Items that fall between the first and second forecast lines indicate what can be completed in the named sprint.
Review the forecast results
- Check the results manually to understand discrepancies in what you expect and what the forecast tool displays.
- Check the amount of effort (Effort, Story Points, or Size) forecasted per sprint.
- Question forecast results where the effort of an item is near to, or greater than, team velocity.
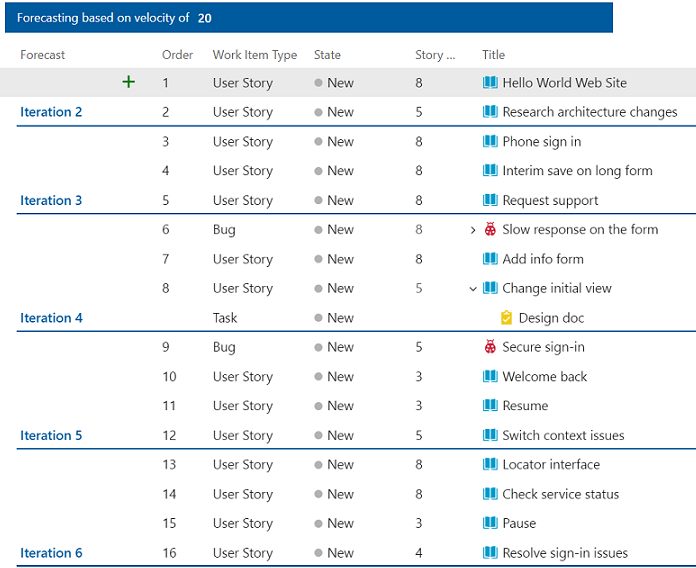
In this example, a Velocity of 20 is used. The forecast tool limits the number of items that are shown between the forecast lines to those items that can be completed within the sprint or using unused velocity points from the previous sprint.
The forecast tool shows between two and four items can be worked on during Iterations 2 through 6 based on the number of Story Points you assigned to each user story or bug. The forecast logic carries over velocity points from one sprint to the next.
Iteration 2: 13 Story Points, items 1 and 2 can be completed; 7 velocity points are carried over to the next sprint
Iteration 3: 24 Story Points, items 3 through 5 can be completed; 3 (=20+7-24) velocity points are carried over to the next sprint
Iteration 4: 21 Story points, items 6 through 8 can be completed; 2 (=20+3-21) velocity points are carried over to the next sprint
Iteration 5: 16 Story points, items 9 through 12 can be completed; 6 (=20+2-16) velocity points are carried over to the next sprint
Iteration 6: 23 Story points, items 13 through 16 can be completed; 3 (=20+6-23) velocity points are carried over to the next sprint
Determine the velocity needed to complete all items in the backlog
Another way to use the forecast tool is to enter different velocity values until all the backlog items are completed within a given set of sprints. This forecast provides an estimate of what velocity is required to complete your backlog of items.
You can then assess the delta between the current team's velocity and the required velocity. The delta helps determine what other resources are required to meet production demands within a required time.
Next steps
Related articles
- Team velocity
- Define iteration paths (sprints) and configure team iterations
- Use the taskboard to track work during your sprint
- Monitor the sprint burndown chart to determine if your team is on track to complete the sprint plan