Configure a chart for work items widget
TFS 2018
The Chart for Work Items widget lets you select any flat-list query and configure it to support any of the supported chart types. The steps you take to configure this widget are very similar to those you take to configure a query-based chart.
To view a chart on a dashboard, you can start from Queries>Charts page and choose to add the chart to the dashboard. Charts added to the dashboard show up as a Chart for Work Items widget that you can relabel, resize, and reconfigure. Or, you can add a Chart for Work Items widget, select the query, and configure the chart as normal.
Prerequisites
Prerequisites to meet include having the necessary permissions, defining and saving a flat-list query under the Shared Queries folder, and creating the dashboard where you want to add the widget.
Permissions
By default, users with Basic access or higher can create charts. Users with Stakeholder access can't view or create charts from the Queries page, however, they can view charts added to a team dashboard. For details, see Stakeholder access quick reference.
- To save a query to a Shared Queries folder, you must be granted permissions to save queries under a folder. To get permissions granted, see Set permissions on queries and query folders.
- To add a widget to a team dashboard, you must be a member of the team or be a member of the Project Administrators security group.
- To view a query-based widget added to a dashboard, you must have Read permissions to the underlying query. If that permission has been denied, then the widget will display with a Widget failed to load message.
To learn more about dashboard permissions, see Set dashboard permissions.
Define and save a flat-list query
From the Chart for Work Items widget, you select the query that contains the work items you want to chart. When creating a query to support your chart, follow the guidelines provided in Create a flat-list query.
Tip
If you start to configure a Chart for Work Items widget and then add the query you want to select, you must refresh your dashboard browser page in order to select the newly added query.
Create a dashboard
Prior to adding a widget to a dashboard, you must first add the dashboard to the project. To learn how, see Add, rename, and delete dashboards.
Add the Chart for Work Items widget to a dashboard
From the web portal, open the team dashboard you want to add the chart to.
To add widgets to the dashboard, select
 Edit. The widget catalog will automatically open. Add all the widgets that you want and drag their tiles into the sequence you want.
If you don't see these icons, then you need to be added as a team administrator or a member of the Project Administrators group.
Select the Chart for work items widget and then select Add.
Select the widget's
 gear icon to open the configuration dialog.
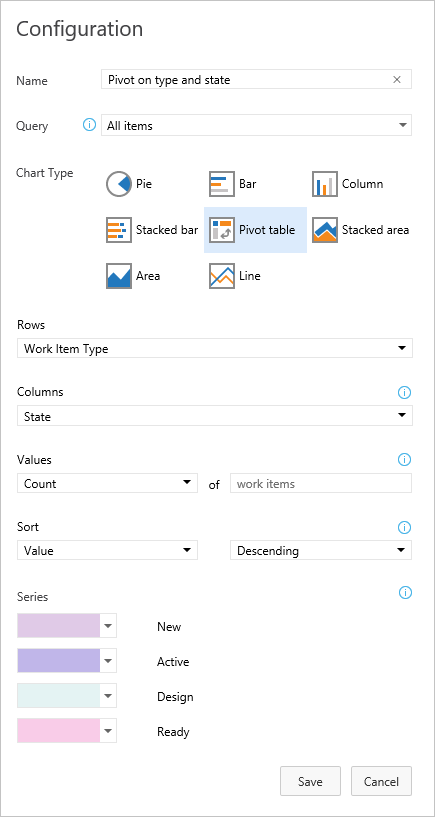
Give the chart a title, select the flat list query on which the chart is based, and choose the chart type. For guidance on choosing the chart type, see Track progress with status and trend query-based charts .
Based on your chart type, specify values for the remaining fields. Change a chart color simply by choosing another color from those shown.
Note
All rules for configuring charts described previously in this article apply to configuring the chart for work items widget.
After you save your changes, you'll see the new chart has been added to the dashboard.
Tip
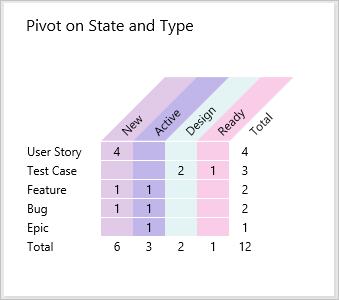
If the chart doesn't display all the rows or columns you want, try changing the chart Size. Pivot tables and other chart types will display more data based on the area provided on the dashboard.
Drag the tile anywhere on the dashboard to put it where you want it.
When you're finished with your changes, select
 to exit dashboard editing.