Note
Access to this page requires authorization. You can try signing in or changing directories.
Access to this page requires authorization. You can try changing directories.
TFS 2017 | TFS 2015 | TFS 2013
With the Code Churn report, you can analyze how source files are changing over time. This report shows how many lines of code the team added, deleted, or modified during the most recent four weeks.
For information about how to access this report, see Excel reports.
Note
You can view the Code Churn report from the Quality dashboard. You can access this dashboard only if your team project portal has been enabled and is provisioned to use Microsoft Office SharePoint Server 2007. For more information, see Configure or redirect process guidance.
Required Permissions
To view the report, you must be assigned or belong to a group that has been assigned the Read permissions in SharePoint Products for the team project.
To modify or customize the report, you must be a member of the TfsWarehouseDataReaders security role in SQL Server Analysis Services. You must also be assigned or belong to a group that has been assigned the Members permissions in SharePoint Products for the team project. For more information, see Grant Access to the Databases of the Data Warehouse for Team System.
Data in the Report
The team can review the Code Churn report to determine how volatile the code base is and how many lines of code were modified in the previous week. As the following illustration shows, the report provides a stacked area graph of the lines of code that the team added, deleted, or modified in the most recent four weeks.
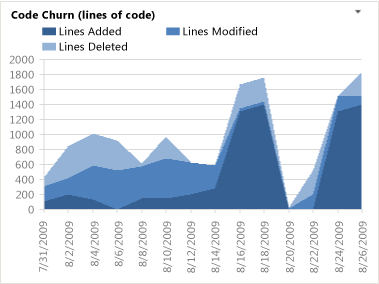
This report is based on a PivotChart report that shows the most recent four weeks of data that were captured for code changes and that is stored in the data warehouse. All lines are counted, even lines that contain comments or that are blank.
Required Activities for Tracking Code Churn
For the Code Churn report to be useful and accurate, team members must perform the following activities:
Configure a build system. To use Team Foundation Build, you must set up a build system.
For more information, see Build and Release agents.
Create build pipelines. You can create several build pipelines, and run each of them to produce code for a different platform. Also, you can run each build for a different configuration.
For more information, see Get started with CI/CD.
Define tests to run automatically as part of the build. As part of the build pipeline, you can define tests to run as part of the build or to fail if the tests fail.
For more information, see Set up continuous testing for your builds.
Configure tests to gather code coverage data. For code coverage data to appear in the report, team members must instrument tests to gather that data.
For more information, see Code Coverage configuration using Test Settings is deprecated and (NIB) How to: Gather Code-Coverage Data with Generic Tests.
Run builds regularly. You can run builds at set intervals or after every check-in. You can create regular builds when you use the schedule trigger.
For more information, see Build triggers.
Note
Although a team member can manually rate a build by using Build Explorer, this rating is not reflected in the Build Quality Indicators report. The build rating appears in the Build Summary report. For more information, see Rate the quality of a completed build and Build Summary.
Interpreting the Report
Code churn is a good measure to quantify the amount of change that is occurring in your project. In general, high levels of code churn indicate a less stable project. You should expect high rates of code churn at the start of a product cycle or when the team has implemented many changes. Toward the end of an iteration or before a release, you should expect the level of code churn to decrease, which indicates that your project is more stable.
You can review the Code Churn report to answer these questions:
How much of the code is the team testing?
Is the team testing enough of the code?
Based on the code coverage and test metrics, is the team likely to meet target goals?
For more information about how code churn affects quality, see Quality.
Customizing the Report
You can customize the Code Churn report by opening it in Office Excel and changing the filter options or a column field list for the PivotTable report. You can modify the report to support other views as the following table describes.
| View | Action |
|---|---|
| Code churn for an iteration | Change the filter for Iteration (default=All) |
| Code churn for a product area | Change the filter for Area (default=All) |
| Code churn for the most recent six, eight, or more weeks | In the Columns PivotTable Field List, replace @@Last 4 weeks@@ with a different Set |