Tutorial: Visualize and analyze events from Azure Digital Twins by using Time Series Insights
Important
A new version of the Azure Digital Twins service has been released. In light of the new service's expanded capabilities, the original Azure Digital Twins service (described in this documentation set) has been retired.
To view the documentation for the new service, visit the active Azure Digital Twins Documentation.
After you deploy your Azure Digital Twins instance, provision your spaces, and implement a custom function to monitor specific conditions, you can visualize the events and data coming from your spaces to look for trends and anomalies.
In the first tutorial, you configured the spatial graph of an imaginary building, with a room that contains sensors for motion, carbon dioxide, and temperature. In the second tutorial, you provisioned your graph and a user-defined function. The function monitors these sensor values and triggers notifications for the right conditions. That is, the room is empty, and the temperature and carbon dioxide levels are normal.
This tutorial shows you how you can integrate the notifications and data coming from your Azure Digital Twins setup with Azure Time Series Insights. You can then visualize your sensor values over time. You can look for trends such as which room is getting the most use and which are the busiest times of the day. You can also detect anomalies such as which rooms feel stuffier and hotter, or whether an area in your building is sending consistently high temperature values, indicating faulty air conditioning.
In this tutorial, you learn how to:
- Stream data by using Azure Event Hubs.
- Analyze with Time Series Insights.
Prerequisites
This tutorial assumes that you have configured and provisioned your Azure Digital Twins setup. Before proceeding, make sure that you have:
- An Azure account.
- An instance of Digital Twins running.
- The Digital Twins C# samples downloaded and extracted on your work machine.
- .NET Core SDK version 2.1.403 or later on your development machine to run the sample. Run
dotnet --versionto verify that the right version is installed.
Tip
Use a unique Digital Twins instance name if you're provisioning a new instance.
Stream data by using Event Hubs
You can use the Event Hubs service to create a pipeline to stream your data. This section shows you how to create your event hub as the connector between your Azure Digital Twins and Time Series Insights instances.
Create an event hub
Sign in to the Azure portal.
In the left pane, select Create a resource.
Search for and select Event Hubs. Select Create.
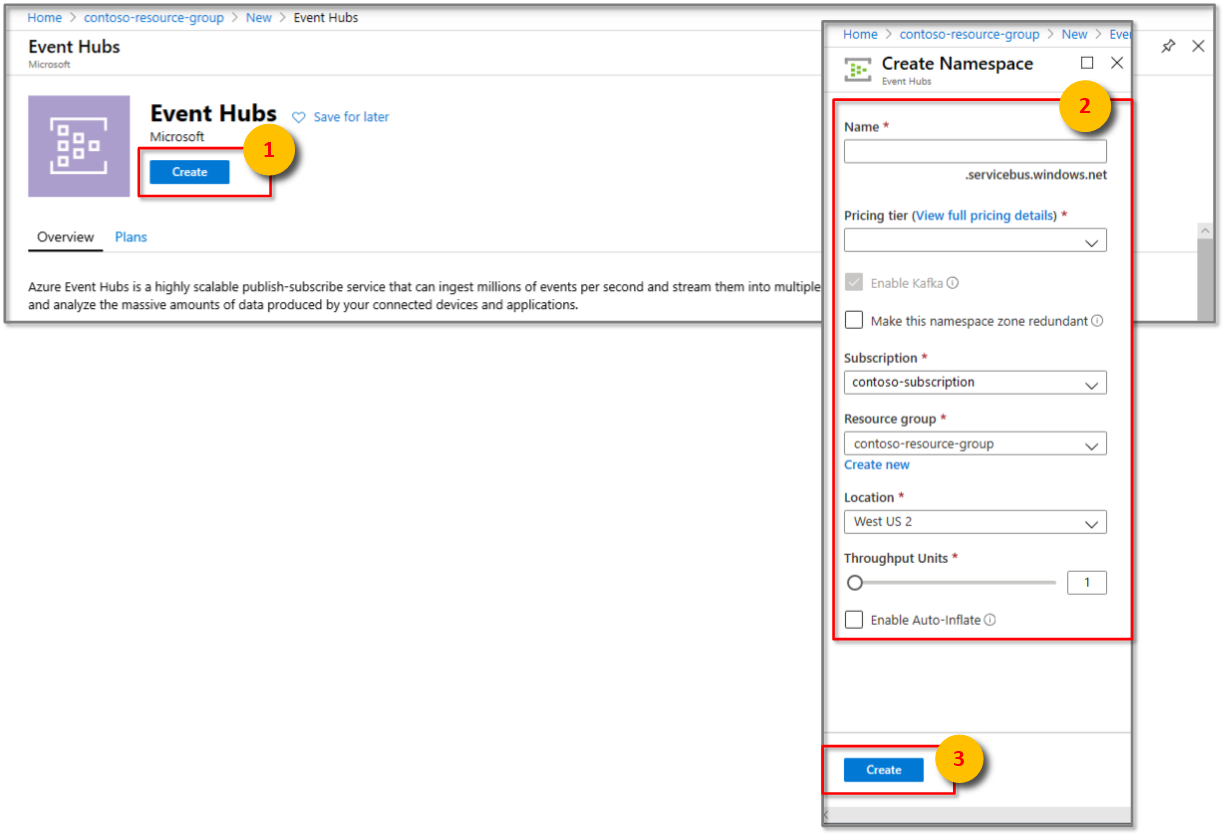
Enter a Name for your Event Hubs namespace. Choose Standard for Pricing tier, your Subscription, the Resource group that you used for your Digital Twins instance, and the Location. Select Create.
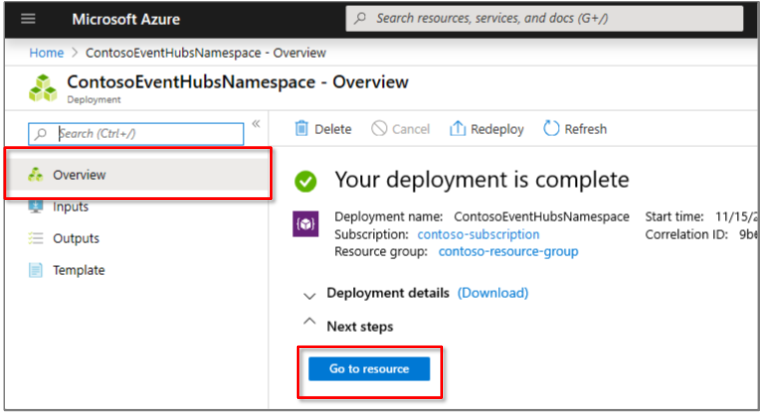
In the Event Hubs namespace deployment, select the Overview pane, then select Go to resource.
In the Event Hubs namespace Overview pane, select the Event Hub button at the top.
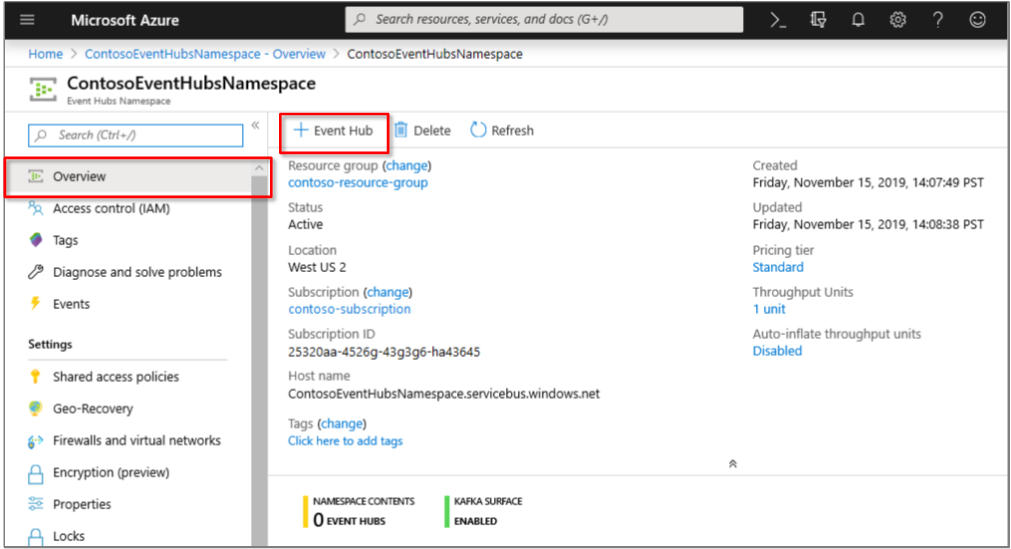
Enter a Name for your event hub, and select Create.
After the event hub is deployed, it appears in the Event Hubs pane of the Event Hubs namespace with an Active status. Select this event hub to open its Overview pane.
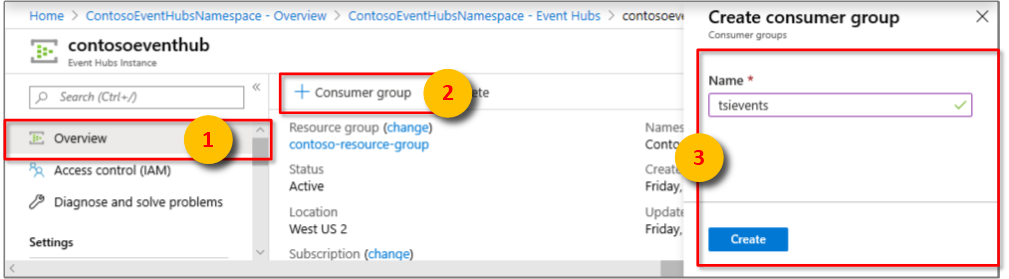
Select the Consumer group button at the top, and enter a name such as tsievents for the consumer group. Select Create.
After the consumer group is created, it appears in the list at the bottom of the event hub's Overview pane.
Open the Shared access policies pane for your event hub, and select the Add button. Enter ManageSend as the policy name, make sure all the check boxes are selected, and select Create.
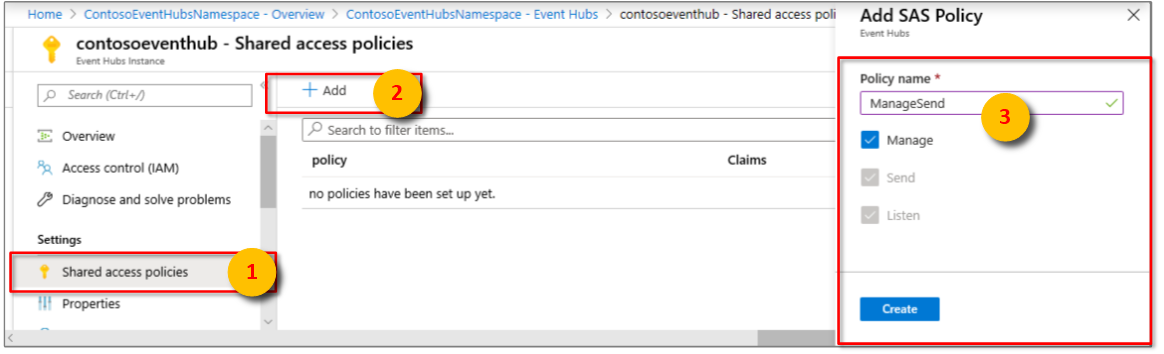
Tip
Verify that you are creating an SAS Policy for your event hub instance rather than your namespace.
Open the ManageSend policy that you created, and copy the values for Connection string—primary key and Connection string—secondary key to a temporary file. You'll need these values to create an endpoint for the event hub in the next section.


Create an endpoint for the event hub
In the command window, make sure you're in the occupancy-quickstart\src folder of the Azure Digital Twins sample.
Open the file actions\createEndpoints.yaml in your editor. Replace the contents with the following:
- type: EventHub
  eventTypes:
  - SensorChange
  - SpaceChange
  - TopologyOperation
  - UdfCustom
  connectionString: Primary_connection_string_for_your_event_hub
  secondaryConnectionString: Secondary_connection_string_for_your_event_hub
  path: Name_of_your_Event_Hub
- type: EventHub
  eventTypes:
  - DeviceMessage
  connectionString: Primary_connection_string_for_your_event_hub
  secondaryConnectionString: Secondary_connection_string_for_your_event_hub
  path: Name_of_your_Event_Hub
Replace the placeholders
Primary_connection_string_for_your_event_hubwith the value of Connection string—primary key for the event hub. Make sure the format of this connection string is as follows:Endpoint=sb://nameOfYourEventHubNamespace.servicebus.windows.net/;SharedAccessKeyName=ManageSend;SharedAccessKey=yourShareAccessKey1GUID;EntityPath=nameOfYourEventHubReplace the placeholders
Secondary_connection_string_for_your_event_hubwith the value of Connection string—secondary key for the event hub. Make sure the format of this connection string is as follows:Endpoint=sb://nameOfYourEventHubNamespace.servicebus.windows.net/;SharedAccessKeyName=ManageSend;SharedAccessKey=yourShareAccessKey2GUID;EntityPath=nameOfYourEventHubReplace the placeholders
Name_of_your_Event_Hubwith the name of your Event Hub.Important
Enter all values without any quotes. Make sure there's at least one space character after the colons in the YAML file. You can also validate your YAML file contents by using any online YAML validator, such as this tool.
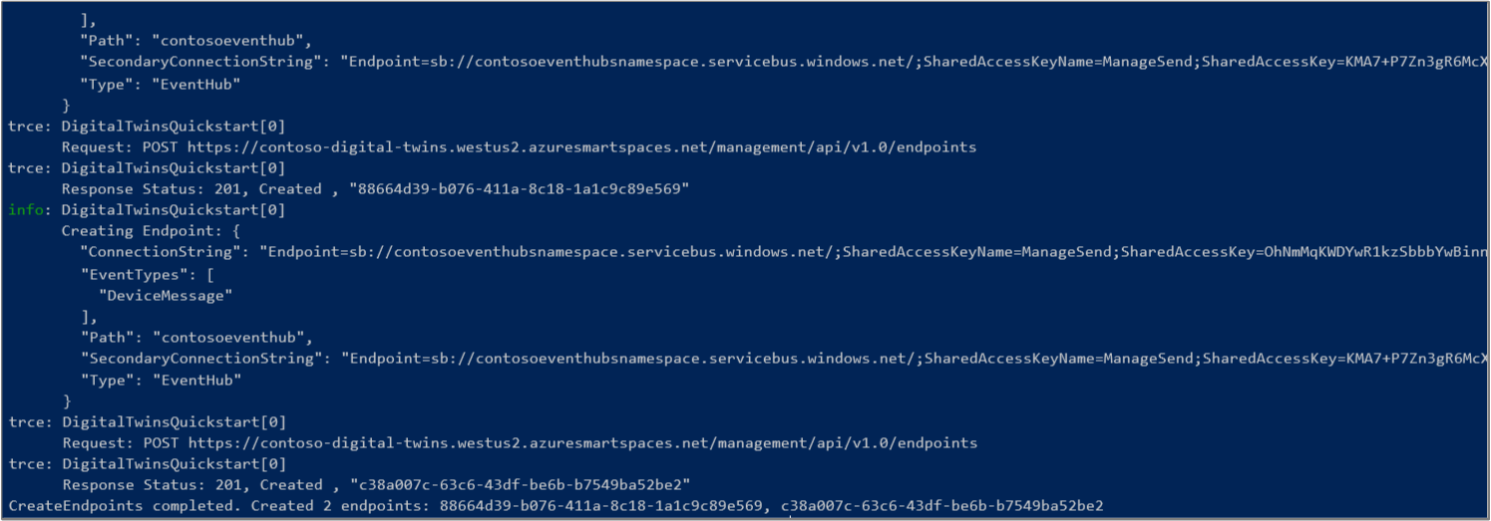
Save and close the file. Run the following command in the command window, and sign in with your Azure account when prompted.
dotnet run CreateEndpointsIt creates two endpoints for your event hub.

Analyze with Time Series Insights
In the left pane of the Azure portal, select Create a resource.
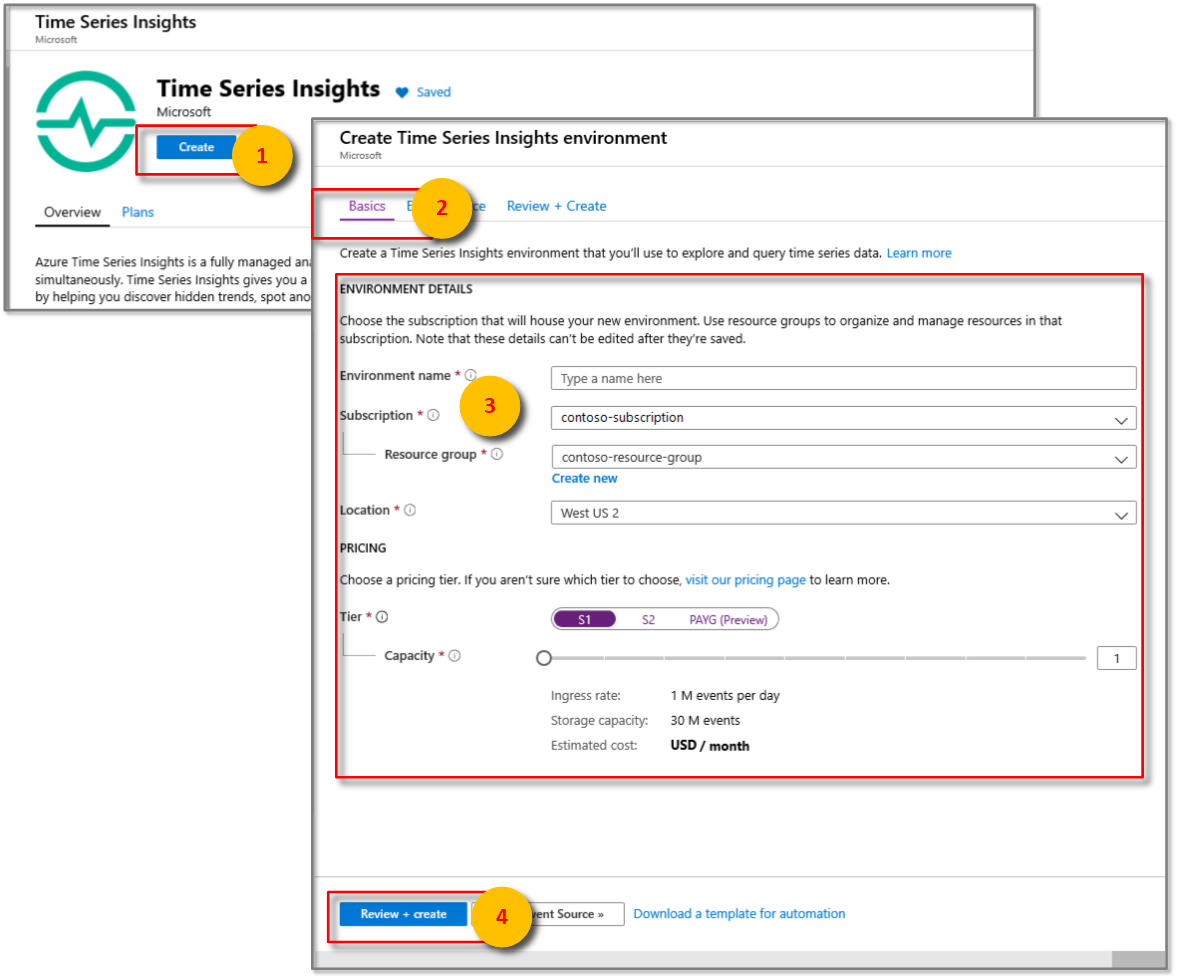
Search for and select a Time Series Insights General Availability (GA) resource. Select Create.
Enter a Name for your Time Series Insights instance, and then select your Subscription. Select the Resource group that you used for your Digital Twins instance, and your Location. Select Next: Event Source button or the Event Source tab.
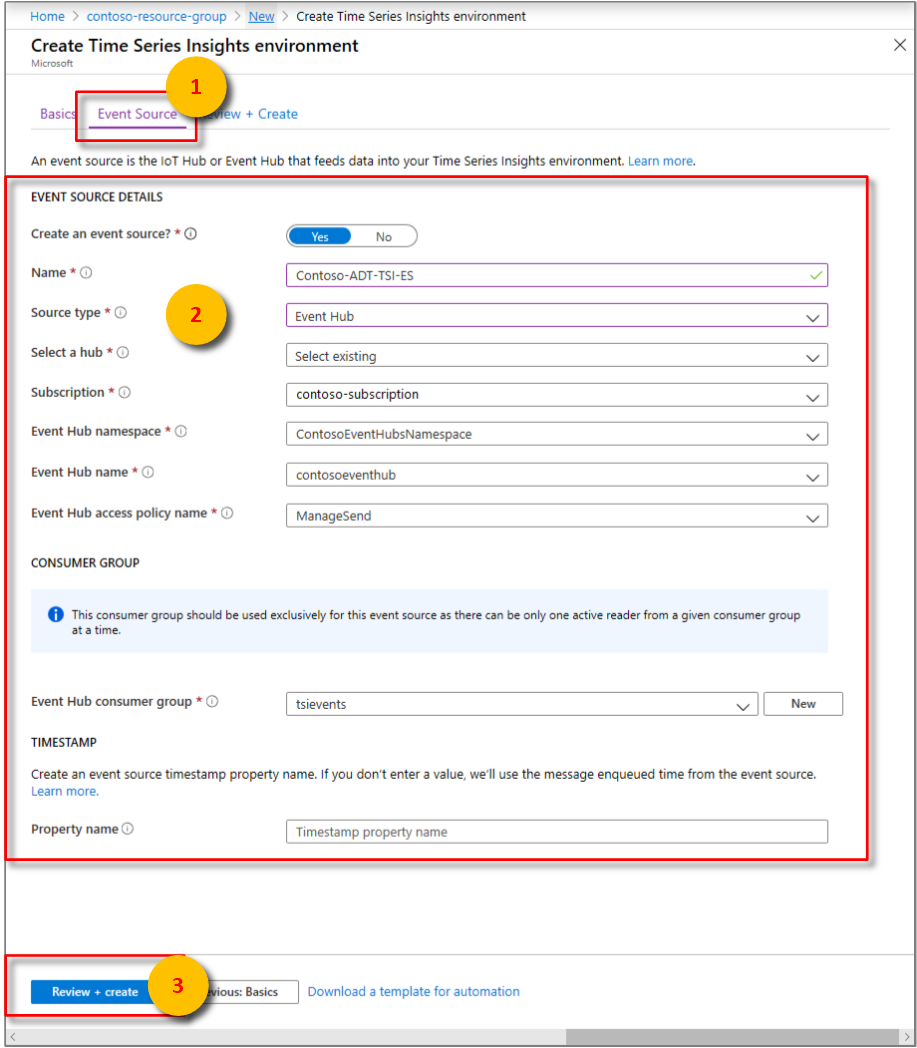
In the Event Source tab, enter a Name, select Event Hub as the Source type, and make sure the other values are selected correctly to reference the event hub you created. Select ManageSend for Event Hub access policy name, and then select the consumer group that you created in the previous section for Event Hub consumer group. Select Review + create.
In the Review + Create pane, review the information you entered, and select Create.
In the deployment pane, select the Time Series Insights resource you created. It opens the Overview pane for your Time Series Insights environment.
Select the Go to Environment button at the top. If you get a data access warning, open the Data Access Policies pane for your Time Series Insights instance, select Add, select Contributor as the role, and select the appropriate user.
The Go to Environment button opens the Time Series Insights explorer. If it doesn't show any events, simulate device events by browsing to the device-connectivity project of your Digital Twins sample, and running
dotnet run.After a few simulated events are generated, go back to the Time Series Insights explorer, and select the refresh button at the top. Your analytical charts that are being created for your simulated sensor data will appear.
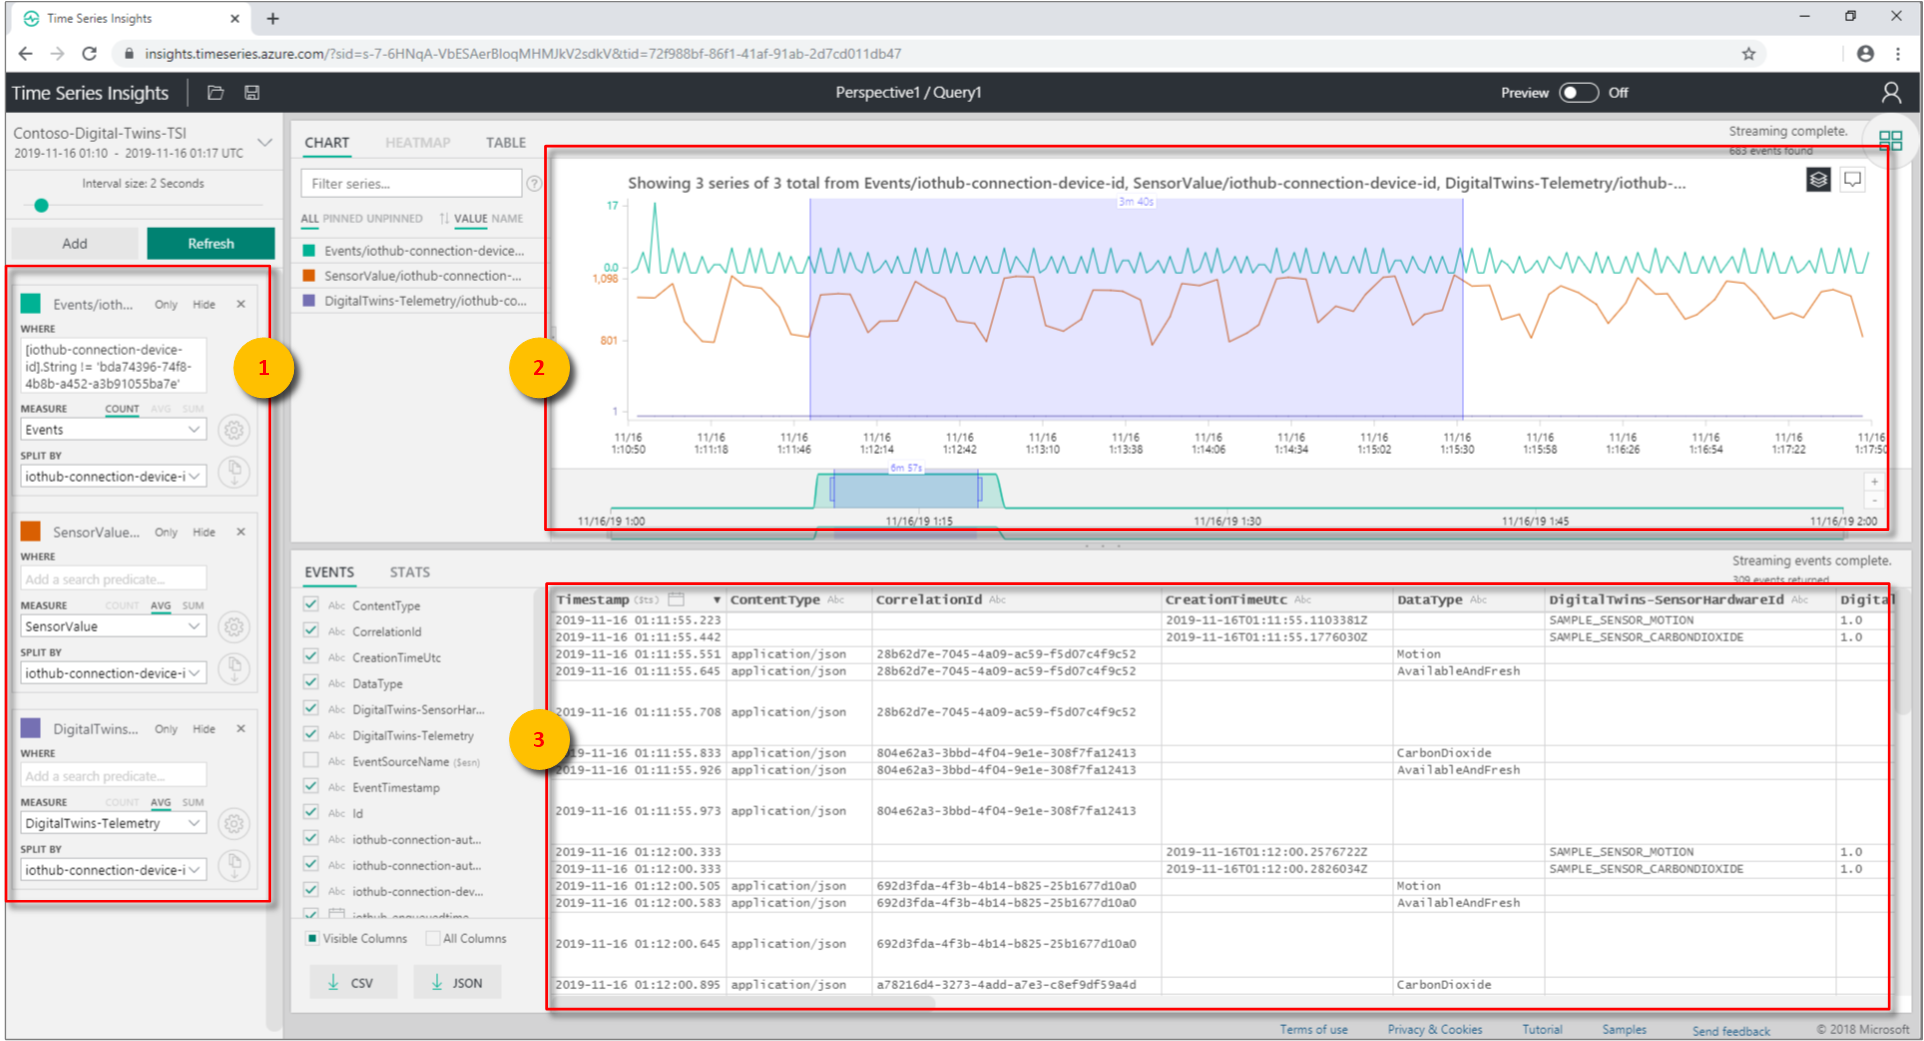
In the Time Series Insights explorer, you can then generate charts and heatmaps for different events and data from your rooms, sensors, and other resources. On the left side, use the MEASURE and SPLIT BY drop-down boxes to create your own visualizations.
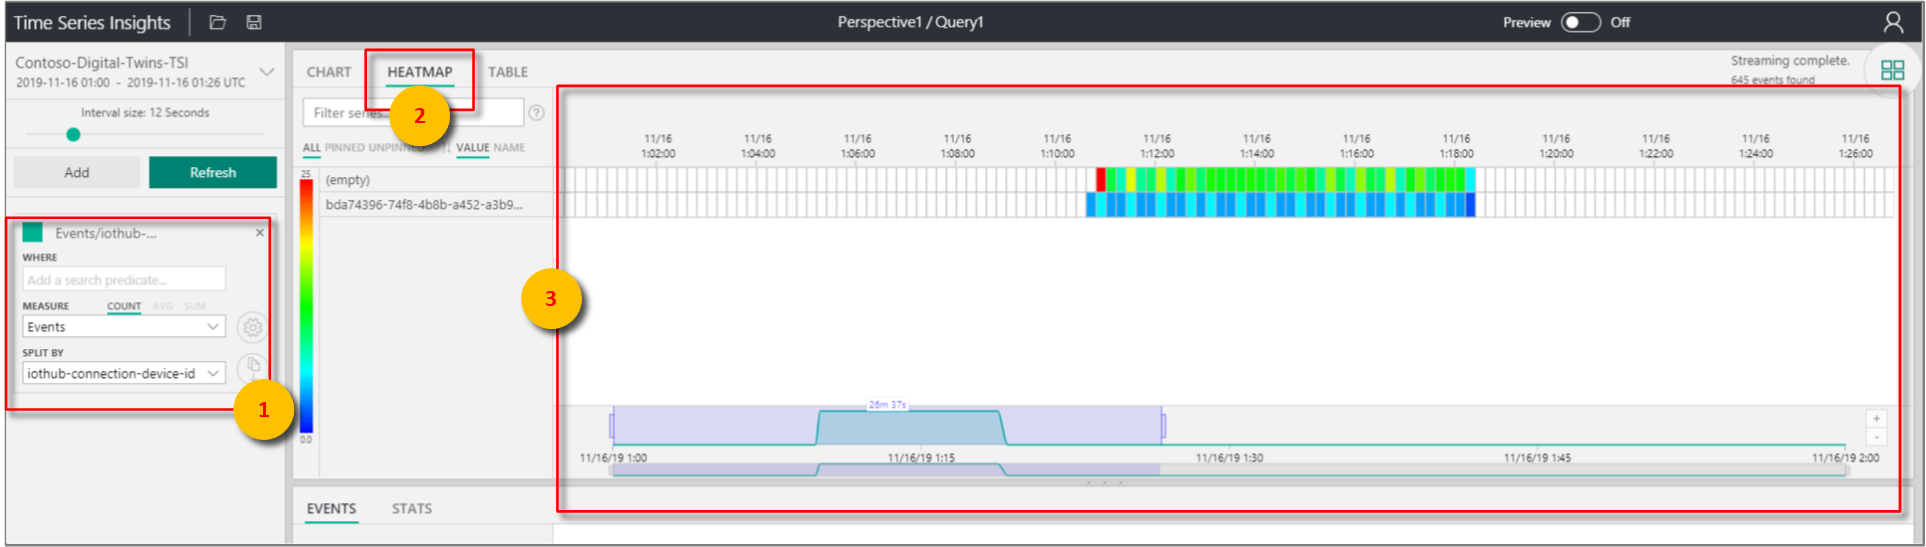
For example, select Events for MEASURE and DigitalTwins-SensorHardwareId for SPLIT BY, to generate a heatmap for each of your sensors. The heatmap will be similar to the following image:


Clean up resources
If you want to stop exploring Azure Digital Twins beyond this point, feel free to delete resources created in this tutorial:
From the left menu in the Azure portal, select All resources, select your Digital Twins resource group, and then select Delete.
Tip
If you experienced trouble deleting your Digital Twins instance, a service update has been rolled out with the fix. Please retry deleting your instance.
If necessary, delete the sample applications on your work machine.
Next steps
Go to the next article to learn more about spatial intelligence graphs and object models in Azure Digital Twins.