Note
Access to this page requires authorization. You can try signing in or changing directories.
Access to this page requires authorization. You can try changing directories.
This article provides information about how you can access the source code and customize the Remote Monitoring solution accelerator UI.
Azure Cloud Shell
Azure hosts Azure Cloud Shell, an interactive shell environment that you can use through your browser. You can use either Bash or PowerShell with Cloud Shell to work with Azure services. You can use the Cloud Shell preinstalled commands to run the code in this article, without having to install anything on your local environment.
To start Azure Cloud Shell:
| Option | Example/Link |
|---|---|
| Select Try It in the upper-right corner of a code or command block. Selecting Try It doesn't automatically copy the code or command to Cloud Shell. |  |
| Go to https://shell.azure.com, or select the Launch Cloud Shell button to open Cloud Shell in your browser. |  |
| Select the Cloud Shell button on the menu bar at the upper right in the Azure portal. |  |
To use Azure Cloud Shell:
Start Cloud Shell.
Select the Copy button on a code block (or command block) to copy the code or command.
Paste the code or command into the Cloud Shell session by selecting Ctrl+Shift+V on Windows and Linux, or by selecting Cmd+Shift+V on macOS.
Select Enter to run the code or command.
Prepare a local development environment for the UI
The Remote Monitoring solution accelerator UI code is implemented using the React.js framework. You can find the source code in the azure-iot-pcs-remote-monitoring-webui GitHub repository.
To make changes to the UI, you can run a copy of it locally. To complete actions such as retrieving telemetry, the local copy connects to a deployed instance of the solution.
The following steps outline the process to set up a local environment for UI development:
Deploy a basic instance of the solution accelerator using the pcs CLI. Make a note of the name of your deployment and the credentials you provided for the virtual machine. For more information, see Deploy using the CLI.
To enable SSH access to the virtual machine that hosts the microservices in your solution, use the Azure portal or the Azure Cloud Shell. For example:
az network nsg rule update --name SSH --nsg-name {your solution name}-nsg --resource-group {your solution name} --access AllowOnly enable SSH access during test and development. If you enable SSH, you should disable it as soon as you're finished using it.
Use the Azure portal or the Azure Cloud Shell to find the name and public IP address of your virtual machine. For example:
az resource list --resource-group {your solution name} -o table
az vm list-ip-addresses --name {your vm name from previous command} --resource-group {your solution name} -o table
Use SSH to connect to your virtual machine. Use the IP address from the previous step, and the credentials you provided when you ran pcs to deploy the solution. The
sshcommand is available in the Azure Cloud Shell.To allow the local UX to connect, run the following commands at the bash shell in the virtual machine:
cd /app
sudo ./start.sh --unsafe
After you see the command completes and the web site starts, you can disconnect from the virtual machine.
In your local copy of the azure-iot-pcs-remote-monitoring-webui repository, edit the .env file to add the URL of your deployed solution:
NODE_PATH = src/
REACT_APP_BASE_SERVICE_URL=https://{your solution name}.azurewebsites.net/
At a command prompt, navigate to your local copy of the
azure-iot-pcs-remote-monitoring-webuifolder.To install the required libraries and run the UI locally, run the following commands:
npm install
npm start
The previous command runs the UI locally at http://localhost:3000/dashboard. You can edit the code while the site is running and see it update dynamically.
Customize the layout
Each page in the Remote Monitoring solution is composed of a set of controls, referred to as panels in the source code. The Dashboard page is made up of five panels: Overview, Map, Alerts, Telemetry, and Analytics. You can find the source code that defines each page and its panels in the pcs-remote-monitoring-webui GitHub repository. For example, the code that defines the Dashboard page, its layout, and the panels on the page is located in the src/components/pages/dashboard folder.
Because the panels manage their own layout and sizing, you can easily modify the layout of a page. Make the following changes to the PageContent element in the src/components/pages/dashboard/dashboard.js file to:
- Swap the positions of the map and telemetry panels.
- Change the relative widths of the map and analytics panels.
<PageContent className="dashboard-container">
  <Grid>
    <Cell className="col-1 devices-overview-cell">
      <OverviewPanel
        activeDeviceGroup={activeDeviceGroup}
        openWarningCount={openWarningCount}
        openCriticalCount={openCriticalCount}
        onlineDeviceCount={onlineDeviceCount}
        offlineDeviceCount={offlineDeviceCount}
        isPending={analyticsIsPending || devicesIsPending}
        error={deviceGroupError || devicesError || analyticsError}
        t={t} />
    </Cell>
    <Cell className="col-6">
      <TelemetryPanel
        timeSeriesExplorerUrl={timeSeriesParamUrl}
        telemetry={telemetry}
        isPending={telemetryIsPending}
        lastRefreshed={lastRefreshed}
        error={deviceGroupError || telemetryError}
        theme={theme}
        colors={chartColorObjects}
        t={t} />
    </Cell>
    <Cell className="col-3">
      <AlertsPanel
        alerts={currentActiveAlertsWithName}
        isPending={analyticsIsPending || rulesIsPending}
        error={rulesError || analyticsError}
        t={t}
        deviceGroups={deviceGroups} />
    </Cell>
    <Cell className="col-4">
      <PanelErrorBoundary msg={t('dashboard.panels.map.runtimeError')}>
        <MapPanel
          analyticsVersion={analyticsVersion}
          azureMapsKey={azureMapsKey}
          devices={devices}
          devicesInAlert={devicesInAlert}
          mapKeyIsPending={azureMapsKeyIsPending}
          isPending={devicesIsPending || analyticsIsPending}
          error={azureMapsKeyError || devicesError || analyticsError}
          t={t} />
      </PanelErrorBoundary>
    </Cell>
    <Cell className="col-6">
      <AnalyticsPanel
        timeSeriesExplorerUrl={timeSeriesParamUrl}
        topAlerts={topAlertsWithName}
        alertsPerDeviceId={alertsPerDeviceType}
        criticalAlertsChange={criticalAlertsChange}
        isPending={analyticsIsPending || rulesIsPending || devicesIsPending}
        error={devicesError || rulesError || analyticsError}
        theme={theme}
        colors={chartColorObjects}
        t={t} />
    </Cell>
    {
      Config.showWalkthroughExamples &&
      <Cell className="col-4">
        <ExamplePanel t={t} />
      </Cell>
    }
  </Grid>
</PageContent>
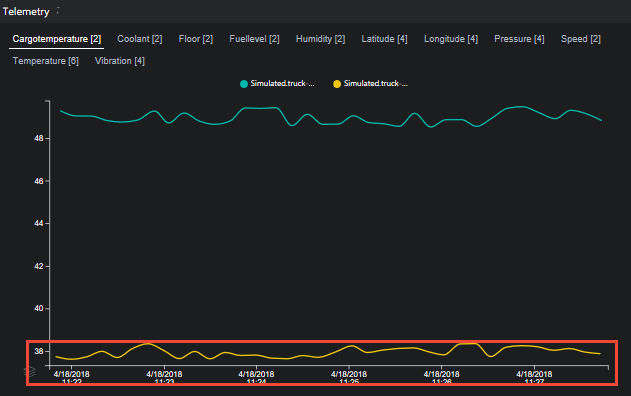
You can also add several instances of the same panel, or several versions if you duplicate and customize a panel. The following example shows you how to add two instances of the telemetry panel. To make these changes, edit the src/components/pages/dashboard/dashboard.js file:
<PageContent className="dashboard-container">
  <Grid>
    <Cell className="col-1 devices-overview-cell">
      <OverviewPanel
        activeDeviceGroup={activeDeviceGroup}
        openWarningCount={openWarningCount}
        openCriticalCount={openCriticalCount}
        onlineDeviceCount={onlineDeviceCount}
        offlineDeviceCount={offlineDeviceCount}
        isPending={analyticsIsPending || devicesIsPending}
        error={deviceGroupError || devicesError || analyticsError}
        t={t} />
    </Cell>
    <Cell className="col-3">
      <TelemetryPanel
        timeSeriesExplorerUrl={timeSeriesParamUrl}
        telemetry={telemetry}
        isPending={telemetryIsPending}
        lastRefreshed={lastRefreshed}
        error={deviceGroupError || telemetryError}
        theme={theme}
        colors={chartColorObjects}
        t={t} />
    </Cell>
    <Cell className="col-3">
      <AlertsPanel
        alerts={currentActiveAlertsWithName}
        isPending={analyticsIsPending || rulesIsPending}
        error={rulesError || analyticsError}
        t={t}
        deviceGroups={deviceGroups} />
    </Cell>
    <Cell className="col-4">
      <PanelErrorBoundary msg={t('dashboard.panels.map.runtimeError')}>
        <MapPanel
          analyticsVersion={analyticsVersion}
          azureMapsKey={azureMapsKey}
          devices={devices}
          devicesInAlert={devicesInAlert}
          mapKeyIsPending={azureMapsKeyIsPending}
          isPending={devicesIsPending || analyticsIsPending}
          error={azureMapsKeyError || devicesError || analyticsError}
          t={t} />
      </PanelErrorBoundary>
    </Cell>
    <Cell className="col-6">
      <AnalyticsPanel
        timeSeriesExplorerUrl={timeSeriesParamUrl}
        topAlerts={topAlertsWithName}
        alertsPerDeviceId={alertsPerDeviceType}
        criticalAlertsChange={criticalAlertsChange}
        isPending={analyticsIsPending || rulesIsPending || devicesIsPending}
        error={devicesError || rulesError || analyticsError}
        theme={theme}
        colors={chartColorObjects}
        t={t} />
    </Cell>
    {
      Config.showWalkthroughExamples &&
      <Cell className="col-4">
        <ExamplePanel t={t} />
      </Cell>
    }
  </Grid>
</PageContent>
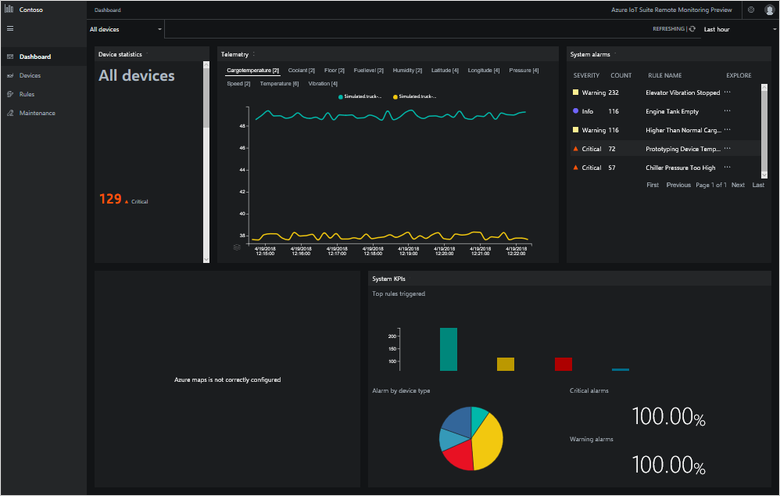
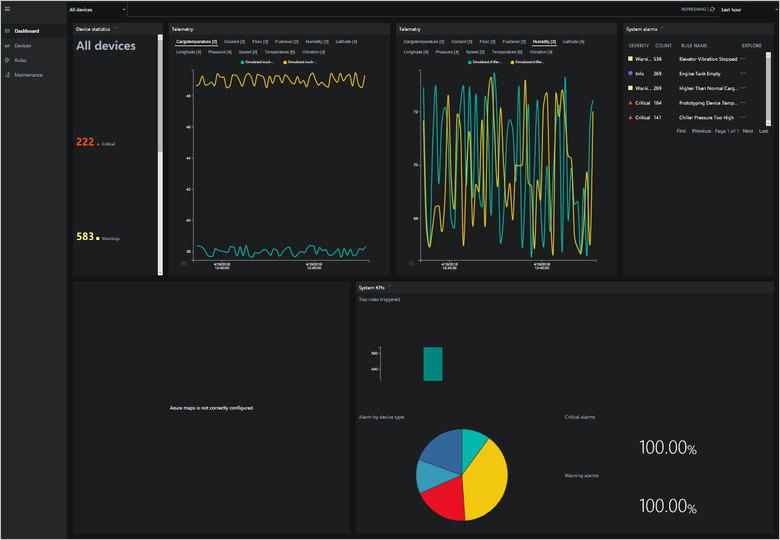
You can then view different telemetry in each panel:
Duplicate and customize an existing control
The following steps outline how to duplicate an existing panel, modify it, and then use the modified version. The steps use the alerts panel as an example:
In your local copy of the repository, make a copy of the alerts folder in the
src/components/pages/dashboard/panelsfolder. Name the new copy cust_alerts.In the alertsPanel.js file in the cust_alerts folder, edit the name of the class to be CustAlertsPanel:
export class CustAlertsPanel extends Component {Add the following line to the
src/components/pages/dashboard/panels/index.jsfile:export * from './cust_alerts';Replace
alertsPanelwithCustAlertsPanelin thesrc/components/pages/dashboard/dashboard.jsfile:import { OverviewPanel, CustAlertsPanel, TelemetryPanel, KpisPanel, MapPanel, transformTelemetryResponse, chartColors } from './panels'; ... <Cell className="col-3"> <CustAlertsPanel alerts={currentActivealertsWithName} isPending={kpisIsPending || rulesIsPending} error={rulesError || kpisError} t={t} /> </Cell>
You've now replaced the original alerts panel with a copy called CustAlerts. This copy is the same as the original. You can now modify the copy. For example, to change the column ordering in the alerts panel:
Open the
src/components/pages/dashboard/panels/cust_alerts/alertsPanel.jsfile.Modify the column definitions as shown in the following code snippet:
this.columnDefs = [
  rulesColumnDefs.severity,
  {
    headerName: 'rules.grid.count',
    field: 'count'
  },
  {
    ...rulesColumnDefs.ruleName,
    minWidth: 200
  },
  rulesColumnDefs.explore
];
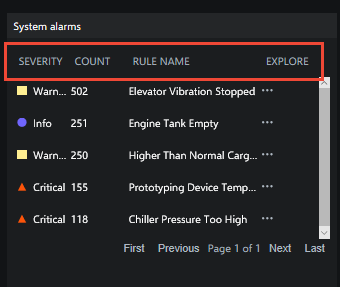
The following screenshot shows the new version of the alerts panel:
Customize the telemetry chart
The files in the src/components/pages/dashboard/panels/telemtry folder define the telemetry chart on the Dashboard page. The UI retrieves the telemetry from the solution back end in the src/services/telemetryService.js file. The following steps show you how to change the time period displayed on the telemetry chart from 15 to 5 minutes:
In the
src/services/telemetryService.jsfile, locate the function called getTelemetryByDeviceIdP15M. Make a copy of this function and modify the copy as follows:static getTelemetryByDeviceIdP5M(devices = []) { return TelemetryService.getTelemetryByMessages({ from: 'NOW-PT5M', to: 'NOW', order: 'desc', devices }); }To use this new function to populate the telemetry chart, open the
src/components/pages/dashboard/dashboard.jsfile. Locate the line that initializes the telemetry stream and modify it as follows:const getTelemetryStream = ({ deviceIds = [] }) => TelemetryService.getTelemetryByDeviceIdP5M(deviceIds)
The telemetry chart now shows the five minutes of telemetry data:
Add a new KPI
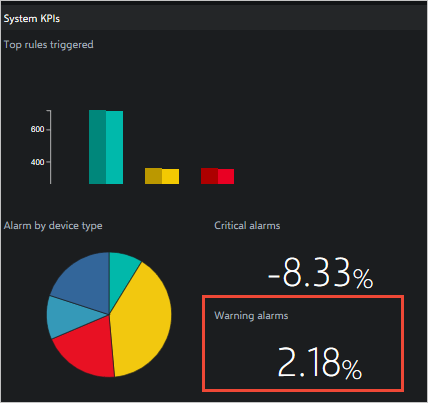
The Dashboard page displays KPIs in the Analytics panel. These KPIs are calculated in the src/components/pages/dashboard/dashboard.js file. The KPIs are rendered by the src/components/pages/dashboard/panels/analytics/analyticsPanel.js file. The following steps describe how to calculate and render a new KPI value on the Dashboard page. The example shown is to add a new percentage change in warning alerts KPI:
Open the
src/components/pages/dashboard/dashboard.jsfile. Modify the initialState object to include a warningAlertsChange property as follows:const initialState = { ... // Analytics data analyticsVersion: 0, currentActiveAlerts: [], topAlerts: [], alertsPerDeviceId: {}, criticalAlertsChange: 0, warningAlertsChange: 0, analyticsIsPending: true, analyticsError: null ... };Modify the currentAlertsStats object to include totalWarningCount as a property:
return {
  openWarningCount: (acc.openWarningCount || 0) + (isWarning && isOpen ? 1 : 0),
  openCriticalCount: (acc.openCriticalCount || 0) + (isCritical && isOpen ? 1 : 0),
  totalWarningCount: (acc.totalWarningCount || 0) + (isWarning ? 1 : 0),
  totalCriticalCount: (acc.totalCriticalCount || 0) + (isCritical ? 1 : 0),
  alertsPerDeviceId: updatedAlertsPerDeviceId
};
Calculate the new KPI. Find the calculation for the critical alerts count. Duplicate the code and modify the copy as follows:
// ================== Warning Alerts Count - START
const currentWarningAlerts = currentAlertsStats.totalWarningCount;
const previousWarningAlerts = previousAlerts.reduce(
  (cnt, { severity }) => severity === Config.ruleSeverity.warning ? cnt + 1 : cnt,
  0
);
const warningAlertsChange = ((currentWarningAlerts - previousWarningAlerts) / currentWarningAlerts * 100).toFixed(2);
// ================== Warning Alerts Count - END
Include the new warningAlertsChange KPI in the KPI stream:
return ({
  analyticsIsPending: false,
  analyticsVersion: this.state.analyticsVersion + 1,

  // Analytics data
  currentActiveAlerts,
  topAlerts,
  criticalAlertsChange,
  warningAlertsChange,
  alertsPerDeviceId: currentAlertsStats.alertsPerDeviceId,

  ...
});
Include the new warningAlertsChange KPI in the state data used to render the UI:
const {
  ...

  analyticsVersion,
  currentActiveAlerts,
  topAlerts,
  alertsPerDeviceId,
  criticalAlertsChange,
  warningAlertsChange,
  analyticsIsPending,
  analyticsError,

  ...
} = this.state;
Update the data passed to the KPIs panel:
<AnalyticsPanel
  timeSeriesExplorerUrl={timeSeriesParamUrl}
  topAlerts={topAlertsWithName}
  alertsPerDeviceId={alertsPerDeviceType}
  criticalAlertsChange={criticalAlertsChange}
  warningAlertsChange={warningAlertsChange}
  isPending={analyticsIsPending || rulesIsPending || devicesIsPending}
  error={devicesError || rulesError || analyticsError}
  theme={theme}
  colors={chartColorObjects}
  t={t} />
You've now finished the changes in the src/components/pages/dashboard/dashboard.js file. The following steps describe the changes to make in the src/components/pages/dashboard/panels/analytics/analyticsPanel.js file to display the new KPI:
Modify the following line of code to retrieve the new KPI value as follows:
const { t, isPending, criticalAlertsChange, warningAlertsChange, alertsPerDeviceId, topAlerts, timeSeriesExplorerUrl, error } = this.props;Modify the markup to display the new KPI value as follows:
<div className="analytics-cell">
  <div className="analytics-header">{t('dashboard.panels.analytics.criticalAlerts')}</div>
  <div className="critical-alerts">
    {
      !showOverlay &&
        <div className="analytics-percentage-container">
          <div className="analytics-value">{ !isNaN(criticalAlertsChange) ? criticalAlertsChange : 0 }</div>
          <div className="analytics-percentage-sign">%</div>
        </div>
    }
  </div>
  <div className="critical-alerts">
    {
      !showOverlay &&
        <div className="analytics-percentage-container">
          <div className="analytics-value">{ !isNaN(warningAlertsChange) ? warningAlertsChange : 0 }</div>
          <div className="analytics-percentage-sign">%</div>
        </div>
    }
  </div>
</div>
The Dashboard page now displays the new KPI value:
Customize the map
See the Customize map page in GitHub for details of the map components in the solution.
Other customization options
To further modify the presentation and visualizations layer in the Remote Monitoring solution, you can edit the code. The relevant GitHub repositories are:
- The configuration microservice for Azure IoT Solutions (.NET)
- The configuration microservice for Azure IoT Solutions (Java)
- Azure IoT PCS Remote Monitoring Web UI
Next steps
In this article, you learned about the resources available to help you customize the web UI in the Remote Monitoring solution accelerator. To learn more about customizing the UI, see the following articles:
- Add a custom page to the Remote Monitoring solution accelerator web UI
- Add a custom service to the Remote Monitoring solution accelerator web UI
- Add a custom grid to the Remote Monitoring solution accelerator web UI
- Add a custom flyout to the Remote Monitoring solution accelerator web UI
- Add a custom panel to the dashboard in the Remote Monitoring solution accelerator web UI
For more conceptual information about the Remote Monitoring solution accelerator, see Remote Monitoring architecture
For more information about customizing the Remote Monitoring solution microservices, see Customize and redeploy a microservice.