Microsoft Office
Get Better Metrics With New Reporting Tools For SharePoint Portal Server
Eric Brown
At a Glance:
- Introduction to the Report Pack for SPS
- Getting the Report Pack for SPS installed
- Using the Data Extraction Program (DEP)
- A tour of the reports
SQL Server Report Pack for SPS
SQL Server
SharePoint Portal Server 2003
If you have Microsoft Office SharePoint Portal Server (SPS) 2003 deployed in your organization, you need some way to know how your SharePoint sites are being used and whether they are configured for efficient operation. In this article,
I will introduce you to the new Microsoft® SQL Server™ Report Pack for SPS 2003. (That’s quite a long name, so from here on I’ll just call it the Report Pack.) After reading this article you will better understand what reports are provided and how they help you better manage SPS.
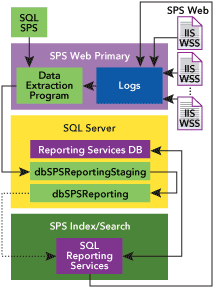
Figure 1 shows the complete architecture and data flow used by the Report Pack. This architecture is intended for mid-size Web farm deployments. The Report Pack contains eight reports divided into three areas. The first area is storage. These reports provide information about the quantity and size of the various types of content stored in the SharePoint® databases.

Figure 1** SQL Report Pack **
The second report area covers site trends. These reports provide insight that traditional Web trending solutions cannot, because Windows® SharePoint Services, or WSS (the basic technology behind SPS), stores data in a binary format not readable by typical log file analyzers. This functionality works along with the Data Extraction Program (DEP), which I’ll discuss later.
The third group of reports covers search terms and keywords. Since search is one of the most valuable features of SPS, these reports help you optimize the search and Best Bets engines.
Users can interact with all of the reports through features of SQL Reporting Services, allowing for easy navigation and manipulation of report data.
Installing the Report Pack
The first step is to download the Report Pack from the Microsoft Web site. The Report Pack must be installed from the front-end Web servers for your SPS deployment. Running setup from this location is essential, as the DEP needs to reside on the same server for security.
The installation process includes creating Reporting Services databases populated with sample data. There are two reporting databases. dbSPSReportingStaging is a simple relational database. Its purpose is to hold the latest data until it can be transformed into the dbSPSReporting database. Typically, DEP is run daily and the data is placed in the dbSPSReportingStaging database. Once the data is loaded the transformation process occurs, moving the data into the dbSPSReporting database.
dbSPSReporting is structured using a star schema design. It contains dimension and fact tables to hold data about the SharePoint environment. Over time this design will help minimize storage requirements. This database also contains the stored procedures that transform data in the staging database for use in the reporting database. You can learn about the schema by opening Enterprise Manager and clicking on Database Diagram.
Data Extraction Program
To display the proper information on your report, data must be extracted from several data sources.
DEP first loads the data into the staging database in the order of IIS logs, WSS logs, and then SharePoint data. As logs are processed, DEP deletes them, so it’s important to use copies of the IIS and WSS logs and not the originals. This allows DEP to restart if needed and resume with the next log file, plus this reduces the risk of the original log file becoming corrupted.
The IIS logs are files that reside on each of the front-end Web servers and collect information on an hourly, daily, or monthly basis. The WSS logs reside on each of the front-end Web servers and gather additional information not captured by the IIS logs. The SharePoint object model is used to gather data from virtual servers and site collections, as well as extract additional information needed for the reports.
To execute more efficiently, DEP also uses LogParser 2.2 to load the data.
Using the Reports
With the data loaded through DEP, you can start taking a look at the reports. Figure 2 provides an overview of the reports available through the Report Pack.
Figure 2 Reports at a Glance
| Description | Report Name |
| Storage | |
| Storage Report | Lists the virtual servers and the number of collections, sites, areas, lists, files, and size. There is also a size distribution and storage usage chart, and a list of the top 20 sites based on size. You can click through the virtual server to go to the Storage Trend Report. |
| Storage Trend Report | Shows four charts illustrating the virtual server storage trend, site collection growth trend, area growth trend, and list growth trend. |
| Hit Trends | |
| Site Trend Report | Shows hit counts for virtual servers, collections, areas, and lists. Also shown are the top 20 sites based on hits. You can click through the virtual server to go to the Comprehensive Site Collections Report. |
| Comprehensive Site Collections Report | Shows the list of site collections, who owns the collection, configurable characteristics about the owner, and the date the collection was last accessed. You can click on a site collection to go to the Detailed Site Collection Report. |
| Detailed Site Collection Report | Shows top 20 pages accessed (based on hit count) for this site collection. You can click on a page to go to the Detailed Page Report. |
| Detailed Page Report | Shows users who have access to this page, when they last accessed it, any referrer URL, and number of hits. Also shown are two charts illustrating user distribution and referrer distribution. |
| Search | |
| Best Bet Keyword | Shows top 20, top 10, bottom 10, or bottom 20 keywords used for searching. It also shows which keywords have best bets. |
| Search Terms | Shows top 20, top 10, bottom 10, or bottom 20 search terms used for searching. It also shows which search terms matched a defined keyword. |
There are two storage analysis reports: the Storage Report and the drill-down Storage Trend Report. The Storage Report begins with a breakdown of the storage and item counts for each virtual server within the farm. The storage is the total amount used for the virtual server in megabytes. The item counts include a count of site collections, sites, areas, lists, and files for the entire virtual server. The item counts and storage amounts are also totaled for the entire farm.
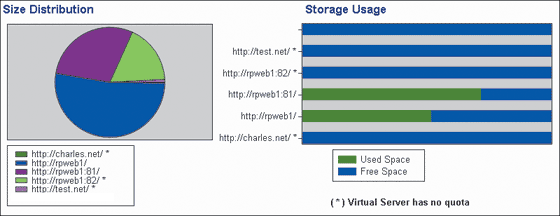
The Storage Report also includes a Size Distribution chart and a Storage Usage chart (see Figure 3). Size Distribution is a pie chart comparing the storage amounts between the virtual servers in the farm. The Storage Usage chart shows how each virtual server’s storage compares to its quota. The green bars represent what percentage of the quota has been consumed. This allows you to see quickly which virtual servers are coming close to their quota and to take action. For this chart, if a virtual server has no quota configured, then the bar is all blue indicating that there are no storage quotas configured.

Figure 3** Site Storage Reporting **
Hit Trend Analysis Reports
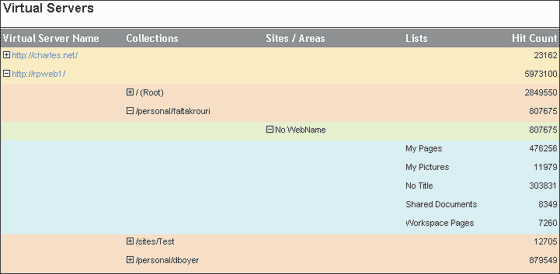
The Site Trend Report shows a summary of hits to the sections of a virtual server. When the report is first presented, there is a summary of virtual servers and the number of hits for each (see Figure 4). The summary section is set up so that you can drill down into the results for more information—notice the + expanders next to each virtual server name. When a virtual server is expanded, you can view the counts for all site collections within the virtual server. When a site collection is expanded, the hit counts for all sites or areas are displayed. And finally, a site or area can be expanded to show the hit counts for individual lists. This section of the report can be helpful if you want to understand the usage of the SharePoint Web farm, particularly the high and low traffic areas.

Figure 4** Virtual Server Hit Count Reporting **
The Comprehensive Site Collections Report begins with a summary of site collections for the selected virtual server. You can also see that the number of sites across the site collections is listed, as is the number of users who have access to the virtual server. Below the summary is a Site Collection Hit Distribution chart that comparatively shows how many hits each of the site collections has received.
Search Pattern Analysis Reports
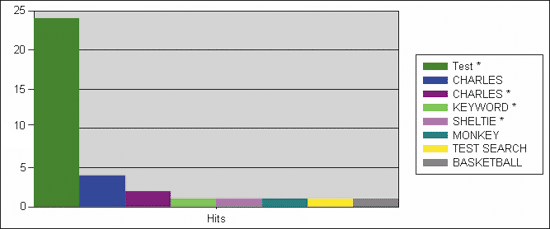
The Best Bet Keyword Report shows the top 20 keywords for all virtual servers (see Figure 5). Keywords that are used to search the site are pulled from the IIS logs. This report can be helpful for making sure the keywords are being utilized. Keep in mind that this report only shows keywords that have been defined within SharePoint and that match a search term typed in by a user. So, if you have defined keywords that aren’t showing up on this report, then those keywords don’t reflect the terms users are actually typing in when they are searching your site. To determine the most popular search terms, see the Search Term Report.

Figure 5** Keyword Hit Reporting **
In addition to keyword utilization, the Best Bet Keyword Report shows which keywords have a Best Bet defined, denoted by a * symbol. A Best Bet can provide helpful links to additional information based on the search terms entered by the user. You can run this report and see the top keywords that are being used, then go into SharePoint and define Best Bets to create more efficient search results for your users.
If you are running SPS and need to keep track of the usage and status of your deployment, SQL Server Report Pack for SharePoint Portal Server should get you well on your way. And if you find you need to develop specific reports for your organization, the Report Pack also can be customized easily through Visual Studio® .NET 2003 and Report Designer.
Eric Brown has published a number of papers on SQL Server 2005, and has recently finished a book entitled SQL Server 2005 Distilled for Addison-Wesley Professional.
© 2008 Microsoft Corporation and CMP Media, LLC. All rights reserved; reproduction in part or in whole without permission is prohibited.