Note
Access to this page requires authorization. You can try signing in or changing directories.
Access to this page requires authorization. You can try changing directories.
Find memory leaks and inefficient memory use in .NET Framework code by using the Visual Studio managed memory analyzer. The minimum .NET Framework version of the target code is .NET Framework 4.5.
The memory analysis tool analyzes information in dump files with heap data that a copy of the objects in an app's memory. You can collect dump (.dmp) files from the Visual Studio IDE or by using other system tools.
You can analyze a single snapshot to understand the relative impact of the object types on memory use, and to find code in your app that uses memory inefficiently.
You can also compare (diff) two snapshots of an app to find areas in your code that cause the memory use to increase over time.
For a walkthrough of the managed memory analyzer, see Using Visual Studio 2013 to Diagnose .NET Memory Issues in Production on the Visual Studio ALM + Team Foundation Server blog .
Contents
Memory use in .NET Framework apps
Identify a memory issue in an app
Memory use in .NET Framework apps
The .NET Framework is a garbage-collected runtime, so that in most apps, memory use is not a problem. But in long-running applications like web services and applications, and in devices that have a limited amount of memory, the accumulation of objects in memory can impact the performance of the app and the device that it runs on. Excessive memory use can starve the application and the machine of resources if the garbage collector is running too often, or if the operating system is forced to move memory between RAM and disk. In the worst case, an app can crash with an "Out of memory" exception.
The .NET managed heap is a region of virtual memory where reference objects created by an app are stored. The lifetime of objects are managed by the garbage collector (GC). The garbage collector uses references to keep track of objects that occupy blocks of memory. A reference is created when an object is created and assigned to a variable. A single object can have multiple references. For example, additional references to an object can be created by adding the object to a class, collection, or other data structure, or by assigning the object to a second variable. A less obvious way of creating a reference is by one object adding a handler to another object's event. In this case, the second object holds the reference to the first object until the handler is explicitly removed or the second object is destroyed.
For each application, the GC maintains a tree of references that tracks the objects referenced by the application. The reference tree has a set of roots, which includes global and static objects, as well as associated thread stacks and dynamically instantiated objects. An object is rooted if the object has at least one parent object that holds a reference to it. The GC can reclaim the memory of an object only when no other object or variable in the application has a reference to it.
Identify a memory issue in an app
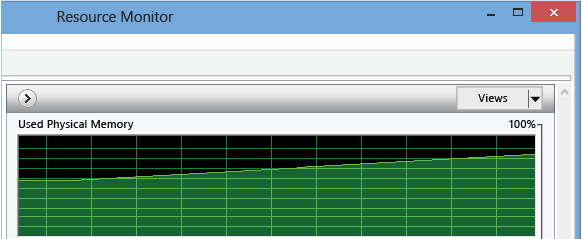
The most visible symptom of memory issues is the performance of your app, especially if the performance degrades over time. Degradation of the performance of other apps while your app is running might also indicate a memory issue. If you suspect a memory issue, use a tool like Task Manager or Windows Performance Monitor to investigate further. For example, look for growth in the total size of memory that you cannot explain as a possible source of memory leaks:
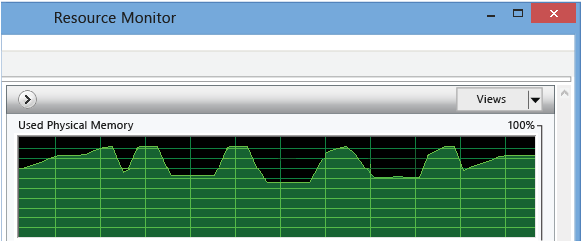
You might also notice memory spikes that are larger than your knowledge of the code would suggest, which might point to inefficient memory use in a procedure:
Collect memory snapshots
The memory analysis tool analyzes information in dump files that contain heap information. You can create dump files in Visual Studio, or you can use a tool like ProcDump from Windows Sysinternals. See What is a dump, and how do I create one? on the Visual Studio Debugger Team blog.
Note
Most tools can collect dump information with or without complete heap memory data. The Visual Studio memory analyzer requires full heap information.
To collect a dump from Visual Studio
You can create a dump file for a process that was started from a Visual Studio project, or you can attach the debugger to a running process. See Attach to Running Processes.
Stop execution. The debugger stops when you choose Break All on the Debug menu, or at an exception or at a breakpoint
On the Debug menu, choose Save Dump As. In the Save Dump As dialog box, specify a location and make sure that Minidump with Heap (the default) is selected in the Save as type list.
To compare two memory snapshots
To analyze the growth in memory use of an app, collect two dump files from a single instance of the app.
Analyze memory use
Filter the list of objects | Analyze memory data in from a single snapshot | Compare two memory snapshots
To analyze a dump file for memory use issues:
In Visual Studio, choose File, Open and specify the dump file.
On the Minidump File Summary page, choose Debug Managed Memory.
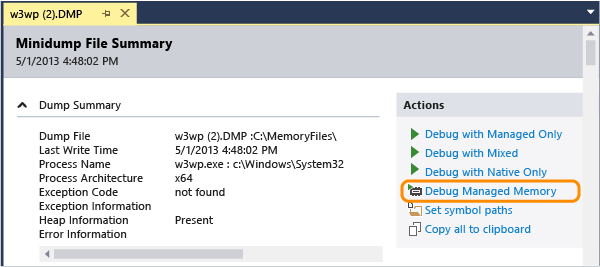
The memory analyzer starts a debug session to analyze the file and displays the results in the Heap View page:
Filter the list of objects
By default, the memory analyzer filters the list of objects in a memory snapshot to show only the types and instances that are user code, and to show only those types whose total inclusive size exceed a threshold percentage of the total heap size. You can change these options in the View Settings list:
| Name | Description |
|---|---|
| Enable Just My Code | Just My Code hides most common system objects, so that only the types that you create are displayed in the list. You can also set the Just My Code option in the Visual Studio Options dialog box. On the Debug menu, choose Options and Settings. In the Debugging/General tab, choose or clear Just My Code. |
| Collapse Small Objects | Collapse Small Objects hides all types whose total inclusive size is less than 0.5 percent of the total heap size. |
You can also filter the type list by entering a string in the Search box. The list displays only those types whose names contain the string.
Analyze memory data in from a single snapshot
Visual Studio starts a new debugging session to analyze the file, and displays the memory data in a Heap View window.
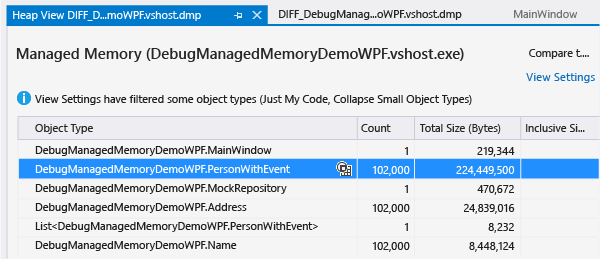
Object Type table
The top table lists the types of objects that are held in memory.
Count shows the number of instances of the type in the snapshot.
Size (Bytes) is the size of the all instances of the type, excluding the size of objects it holds references to. The
Inclusive Size (Bytes) includes the sizes of referenced objects.
You can choose the instances icon (
 ) in the Object Type column to view a list of the instances of the type.
Instance table
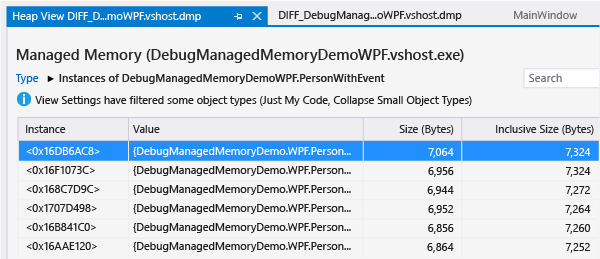
Instance is the memory location of the object that serves as the object identifier of the object
Value shows the actual value of value types. You can hover over the name of a reference type to view its data values in a data tip.

Size (Bytes) is the size of the object, excluding the size of objects it holds references to. The
Inclusive Size (Bytes) includes the sizes of referenced objects.
By default, types and instances are sorted by Inclusive Size (Bytes). Choose a column header in the list to change the sort order.
Paths to Root
For a type selected from the Object Type table, the Paths to Root table shows the unique type hierarchies that lead to root objects for all objects of the type, along with the number of references to the type that is above it in the hierarchy.
For an object selected from the instance of a type, Paths to Root shows a graph of the actual objects that hold a reference to the instance. You can hover over the name of the object to view its data values in a data tip.
Referenced Types / Referenced Objects
For a type selected from the Object Type table, the Referenced Types tab shows the size and number of referenced types held by all objects of the selected type.
For a selected instance of a type, Referenced Objects shows the objects that are held by the selected instance. You can hover over the name to view its data values in a data tip.
Circular references
An object can reference a second object that directly or indirectly holds a reference to the first object. When the memory analyzer encounters this situation, it stops expanding the reference path and adds a [Cycle Detected] annotation to the listing of the first object and stops.
Root types
The memory analyzer adds annotations to root objects that describe the kind of reference that is being held:
| Annotation | Description |
|---|---|
Static variable VariableName |
A static variable. VariableName is the name of the variable. |
| Finalization Handle | A reference from the finalizer queue |
| Local Variable | A local variable. |
| Strong Handle | A handle to a strong reference from the object handle table. |
| Async. Pinned Handle | An asynchronous pinned object from the object handle table. |
| Dependent Handle | A dependent object from the object handle table. |
| Pinned Handle | A pinned strong reference from the object handle table. |
| RefCount Handle | A reference-counted object from the object handle table. |
| SizedRef Handle | A strong handle that keeps an approximate size of the collective closure of all objects and object roots at garbage collection time. |
| Pinned local variable | A pinned local variable. |
Compare two memory snapshots
You can compare two dump files of a process to find objects that might be the cause of memory leaks. The interval between the collection of the first (earlier) and second (later) file should be large enough that the growth of the number of leaked objects is easily apparent. To compare the two files:
Open the second dump file, and then choose Debug Managed Memory on the Minidump File Summary page.
On the memory analysis report page, open the Select baseline list, and then choose Browse to specify the first dump file.
The analyzer adds columns to the top pane of the report that display the difference between the Count, Size, and Inclusive Size of the types to those values in the earlier snapshot.

A Reference Count Diff column is also added to the Paths to Root table.
See Also
VS ALM TFS Blog: Using Visual Studio 2013 to Diagnose .NET Memory Issues in Production
Channel 9 | Visual Studio TV | Managed Memory Analysis
Channel 9 | Visual Studio Toolbox | Managed Memory Analysis in Visual Studio 2013
