Note
Access to this page requires authorization. You can try signing in or changing directories.
Access to this page requires authorization. You can try changing directories.
Applies to: ![]() Visual Studio
Visual Studio ![]() Visual Studio for Mac
Visual Studio for Mac
Note
This article applies to Visual Studio 2017. If you're looking for the latest Visual Studio documentation, see Visual Studio documentation. We recommend upgrading to the latest version of Visual Studio. Download it here
This article describes how to start a Visual Studio debugging session for a Universal Windows Platform (UWP) app. UWP apps can be written in XAML and C++, XAML and C#/Visual Basic. To start debugging a UWP app, configure the debugging session and choose the way to start the app.
In Visual Studio 2017, Most of the commands and options shown in this article also apply to UWP apps for HTML and JavaScript. Where commands are different between managed and C++ apps, JavaScript apps typically are the same as commands for C++ UWP apps.
Start debugging from the Visual Studio toolbar
The easiest way to configure and start debugging is from the standard Visual Studio toolbar.
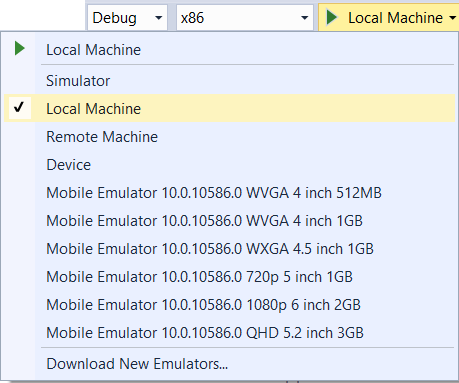
From the Configuration dropdown on the Standard toolbar, select Debug.
From the Platform dropdown, select the target platform to build for.
From the dropdown next to the green arrow, select the debug target. You can choose a local machine, direct-connected device, local Visual Studio simulator, remote device, or emulator.
To start debugging, select the green Start arrow on the toolbar, or select Debug > Start Debugging, or press F5.
Visual Studio builds and starts the app with the debugger attached.
Debugging continues until a breakpoint is reached, you manually suspend execution, an unhandled exception occurs, or the app ends.
Deployment target options
You can set the debugging target in the Visual Studio toolbar or the project's debugging property page. Select one of the following options:
| Name | Description |
|---|---|
| Local Machine | Debug the app in the current session on your local machine. |
| Simulator | Debug the app in the Visual Studio simulator for UWP apps. The simulator is a desktop window that simulates device functions, like touch gestures and device rotation, that may not exist on the local machine. The simulator option is available only if your app's Target Platform Min. Version is less than or equal to the operating system on the local machine. For more information, see Run UWP apps in the simulator. |
| Remote Machine | Debug the app on a device connected to the local machine over a network or Ethernet cable. The Remote Tools for Visual Studio must be installed and running on the remote device. For more information, see Run UWP apps on a remote machine. |
| Device | Debug the app on a USB-connected device. The device must be developer-unlocked and have the screen unlocked. |
| Mobile Emulator | Boot the emulator specified in the emulator name, deploy the app, and start debugging. Emulators are available only on Hyper-V enabled machines. |
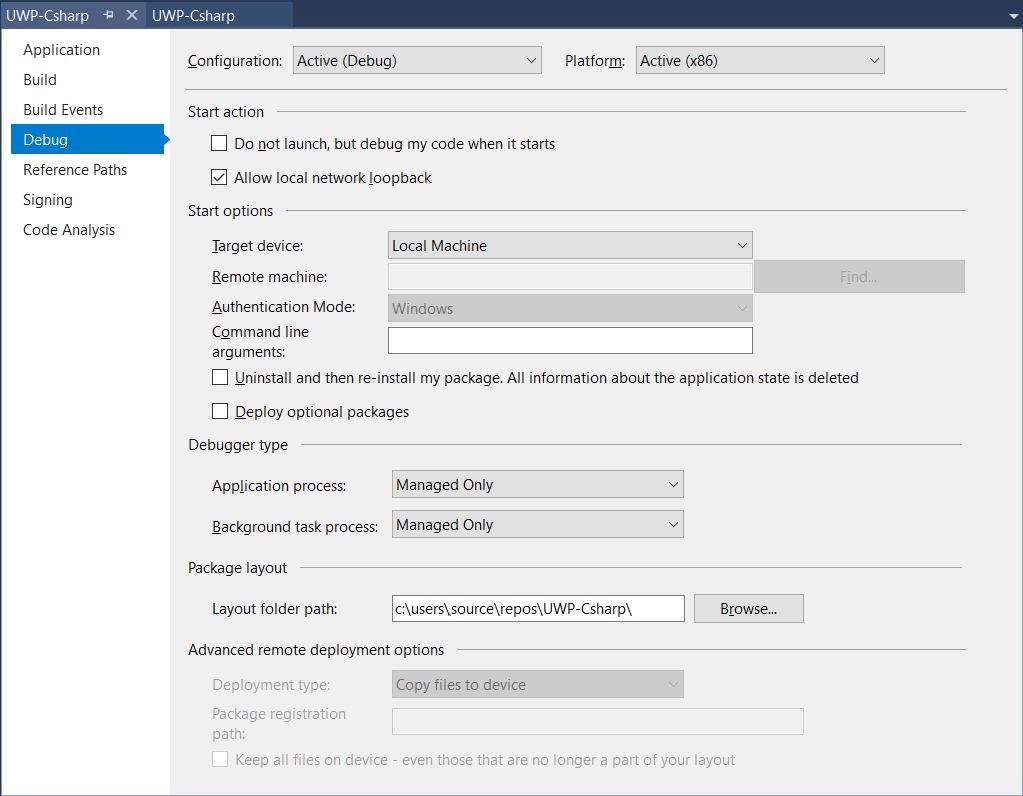
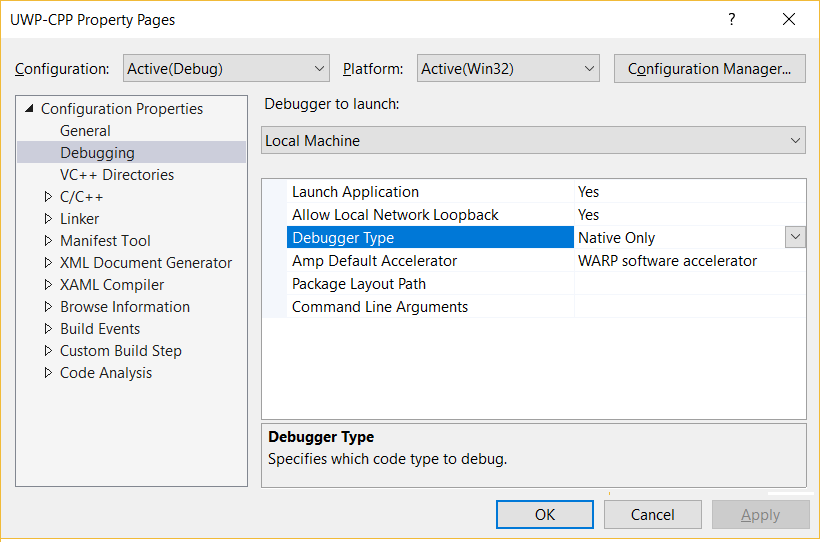
Configure debugging in the project property page
To configure additional debugging options, use the project's debugging properties page.
To open the debugging properties:
In Solution Explorer, select the project and then select the Properties icon, or right-click the project and select Properties.
On the left side of the Properties pane:
For C# and Visual Basic apps, select Debug.
For C++ apps, select Configuration Properties > Debugging.
Choose the debugger to use
For C# and Visual Basic apps, Visual Studio debugs managed code by default. You can choose to debug other or additional code types. You can also set Debugger type values for any background tasks that are part of the project.
In C++ apps, Visual Studio debugs native code by default. You can choose to debug specific types of code instead of, or in addition to, native code.
To specify code types to debug:
For C# and Visual Basic apps, select one of the following debuggers from the Application type and Background process type dropdowns under Debugger type on the Debug property page.
For C++ apps, select one of the following debuggers from the Debugger Type dropdown on the Debugging property page.
| Name | Description |
|---|---|
| Managed Only | Debug managed code in your app. JavaScript code and native C/C++ code are ignored. |
| Native Only | Debug native C/C++ code in your app. Managed code and JavaScript code are ignored. |
| Mixed (Managed and Native) | Debug native C/C++ code and managed code in your app. JavaScript code is ignored. In C++ projects, this option is called Managed and Native. |
| Script | Debug JavaScript code in your app. Managed code and native code are ignored. |
| Native with Script | Debug native C/C++ code and JavaScript code in your app. Managed code is ignored. Available in C++ projects or background tasks only. |
| GPU only (C++ AMP) | Debug native C++ code that runs on a graphics processing unit (GPU). Available in C++ projects only. |
Disable network loopbacks (optional)
For security, a UWP app that is installed in the standard manner can't make network calls to the device it's installed on. Visual Studio exempts deployed apps from this rule by default, so you can test communication procedures on a single machine. Before you release your app, you should test your app without the exemption.
To remove the network loopback exemption:
For C# and Visual Basic apps, deselect the Allow local network loopback check box under Start options on the Debug property page.
For C++ apps, select No from the Allow Local Network Loopback dropdown on the Debugging property page.
Reinstall the app when you start debugging (optional)
To diagnose installation problems with a C# or Visual Basic app, select Uninstall and then re-install my package on the Debug property page. This option recreates the original install when you start debugging. This option isn't available for C++ projects.
Set authentication options for remote debugging
By default, you must supply Windows credentials to run the remote debugger when you select Remote Machine as the deployment target. You can change the authentication requirement.
The Universal (Unencrypted Protocol) authentication mode is for IoT, Xbox, and HoloLens devices, Widows 11 PCs, and Creator's Update or later Windows 10 PCs.
To change authentication method:
For C# and Visual Basic apps, on the Debug property page, select Remote Machine as the Target device. Then, select None or Universal (Unencrypted Protocol) for Authentication Mode.
For C++ apps, select Remote Machine under Debugger to launch on the Debugging property page. Then, select No Authentication or Universal (Unencrypted Protocol) for Authentication Type.
Caution
There is no network security when you run the remote debugger in None or Universal (Unencrypted Protocol) modes. Choose these modes only on trusted networks that you are sure are not at risk from malicious code or hostile traffic.
Debugging start options
When you select Debug > Start Debugging or press F5, Visual Studio launches the app with the debugger attached. Execution continues until a breakpoint is reached, you manually suspend execution, an unhandled exception occurs, or the app ends.
Start debugging but delay app start
By default, Visual Studio starts the app immediately when you start debugging. You can also set the app to run in debug mode, but start the app outside the debugger. For example, you might want to debug app launch from the Windows Start menu, or debug a background process in the app. If you choose this option, the app starts in the debugger on launch.
To disable automatic app startup:
For C# and Visual Basic apps, select Do not launch, but debug my code when it starts under Start options on the Debug property page.
For C++ apps, select No from the Launch Application dropdown on the Debugging property page.
For more information about debugging background tasks, see Trigger suspend, resume, and background events for UWP apps.
Debug an installed or running UWP app
You can use Debug Installed App Package to debug a UWP app that is already installed or running on a local or remote device. The app may have been installed from the Microsoft Store, or it may not be a Visual Studio project. For example, the app might have a custom build system that doesn't use Visual Studio.
You can start the installed app immediately, or you can set it to run in the debugger when started with another method. For more information, see Trigger suspend, resume, and background events for UWP apps).
To start an installed or running UWP app in the debugger, select Debug > Other Debug Targets > Debug Installed App Package. For more instructions, see Debug an installed app package.
Attach the debugger to a running Windows 8.x app
To attach the debugger to a Windows 8.x Store app, you must use the Debuggable Package Manager to set the app to run in debug mode. The Debuggable Package Manager is installed with the Remote Tools for Visual Studio.
Install the Remote Tools for Visual Studio on the device where the app is installed. For more information, see Installing the remote tools.
In the Windows Start screen, search for and start Debuggable Package Manager.
A PowerShell window properly configured for the AppxDebug cmdlet appears.
Specify the PackageFullName identifier of the app.
To view a list that includes the PackageFullName of all apps, type
Get-AppxPackageat the PowerShell prompt.At the PowerShell prompt, enter
Enable-AppxDebug <PackageFullName>, where <PackageFullName> is the PackageFullName identifier of the app.
Select Debug > Attach to Process.
In the Attach to Process dialog box, specify the remote device in the Connection target box.
You can enter the device name, select it from the dropdown in the Connection target box, or select Find to find the device in the Remote Connections dialog box.
To specify the type of code you want to debug, next to the Attach to box, select Select.
In the Select Code Type dialog box, select either:
- Automatically determine the type of code to debug, or
- Debug these code types, and then select one or more code types from the list.
In the Available processes list, select the app process to debug.
Select Attach.
Visual Studio attaches the debugger to the process. Execution continues until a breakpoint is reached, you manually suspend execution, an unhandled exception occurs, or the app ends.
Note
JavaScript apps run in an instance of the wwahost.exe process. If more than one JavaScript app is running, you will need to know the numeric process id (PID) of your app's wwahost.exe process to attach to it.
The easiest way to attach to your JavaScript app is to close all the other JavaScript apps. Or, you can note the PIDs of running wwahost.exe processes in Windows Task Manager before you start your app. When you start your app, its wwahost.exe PID will be the one that is different from those you previously noted.