Note
Access to this page requires authorization. You can try signing in or changing directories.
Access to this page requires authorization. You can try changing directories.
Applies to: ![]() Visual Studio
Visual Studio ![]() Visual Studio for Mac
Visual Studio for Mac
Note
This article applies to Visual Studio 2017. If you're looking for the latest Visual Studio documentation, see Visual Studio documentation. We recommend upgrading to the latest version of Visual Studio. Download it here
View the virtual user activity that's associated with your load test by using the Virtual User Activity Chart. Each row in the chart represents an individual virtual user. The Virtual User Activity Chart shows you exactly what each virtual user was executing during the test. You can see patterns of user activity, load patterns, correlate failed or slow tests, and see requests with other virtual user activity. The Virtual User Activity Chart is available only after the load test has finished running.
Note
Web performance and load test functionality is deprecated. Visual Studio 2019 is the last version where web performance and load testing will be fully available. For more information, see the Cloud-based load testing service end of life blog post. To reduce the impact on users some minimum support is still available in Visual Studio 2022 Preview 3 or later. Users should also note web performance and load test functionality only supports Internet Explorer which is not available on Windows 11 and some versions of Windows 10. Read more on Internet Explorer Lifecycle policy.
The procedures below demonstrate how to view the Virtual User Activity Chart, how to investigate a specific user's activity, and how to use filtering.
To view the Virtual User Activity Chart in your load test results
To view the virtual user data, you must first configure the All Individual Details setting for the Timing Details Storage property that is associated with your load test. Then run the load test.
After your load test runs, the test results summary page is displayed. Choose the User Detail button on the toolbar.
-or-
Open the Graphs view by choosing the Graphs button on the toolbar. Right-click a graph and then select Go to user detail.
If you use this option, the Virtual User Activity Chart will auto-zoom to the part of the test that you right-clicked. For example, if your pointer is located on approximately the 30 second mark, the detail view will display approximately on the 30 second mark in the Zoom to time period tool at the bottom of the Virtual User Activity Chart.
Next, you can use investigate a specific user's activity details in the Virtual User Activity Chart.
To investigate a specific user's activity in the Virtual User Activity Chart
Use the Zoom to time period tool at the bottom of the Virtual User Activity Chart to select an area on the chart where you want to investigate details on a specific user.
Hover your pointer over a detail in the graph. Notice that the following information is displayed in the tool tip:
User Id
Scenario
Test
URL (Does not display in a test or transaction)
Outcome
Browser (Does not display in a test or transaction)
Network
Start Time
Duration
Agent
Test log (Link to the test log)
Note
To assist in debugging your application, if you choose the Test log link, the web test result or unit test result associated with the log open.
Next, you can use the filtering and highlighting operations available in the Virtual User Activity Chart.
To use filtering options in the Virtual User Activity Chart
In the Details Legend, use the drop-down list to select either Test, Page, or Transaction.
Details Legend panel
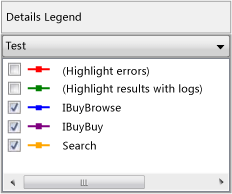
Select or clear the check boxes for the errors, logs, tests, search, and aspx pages that are associated with the load test.
The Virtual User Activity Chart updates accordingly.
The Virtual User Activity Chart provides the ability to filter out tests, pages, and transactions based on several different criteria. You can remove certain tests from the view, or remove all successful tests, or remove tests that failed with certain failures. You can also remove all tests that do not have logs.
For example, you can select the (Highlight errors) option, which displays all errors on the chart colored in red. You can also select the (Highlight results with logs) option, which displays all the test results that have logs colored in green in the chart.
Filter results panel
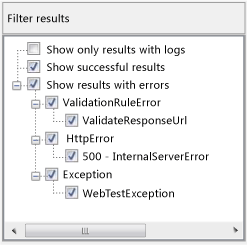
In the Filter results, select or clear the check boxes for the following filter options:
Show only results with logs Displays only test results that have test logs associated with them.
Show successful results Displays successful results.
Show results with errors Displays results with errors that can assist in debugging.
Note
The list of error types that are listed under the Show results with errors node can be further investigated by choosing the Tables button in the Web Performance Test Results Viewer toolbar. For more information, see Analyze load test results and errors in the Tables view.
The Virtual User Activity Chart updates accordingly.