Note
Access to this page requires authorization. You can try signing in or changing directories.
Access to this page requires authorization. You can try changing directories.
Overview: This graph presents a high-level view of CPU usage aggregated by individual CPU, as shown in the following screen shot.
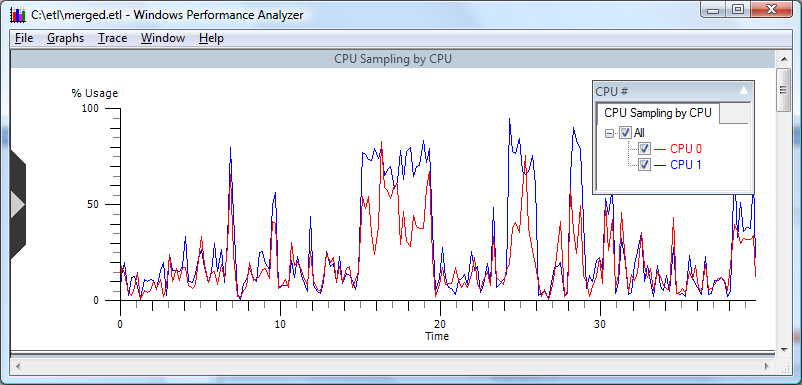
Graph Type: Usage graph
Y-axis Units: Percentage of CPU used
Required Flags: LOADER+ PROC_THREAD+PROFILE
Events Captured: Kernel-mode and user-mode Image Load/Unload, Process and Thread Create/Delete, CPU Sample Profile
Legend Description: Shows active CPUs on the system that were active when the trace was started
Graph Description: Displays data sampled by WPA at millisecond intervals. Specific CPU sampling can be selected by choosing CPU data series from the legend.
Note
Although this graph is referred to as a "usage graph", the data displayed is calculated by sampling CPU activity as opposed to the CPU Usage graphs that calculate the usage based on context switch events. For more information on calculating usage graphs please see Notes on WPA Sampling.