Note
Access to this page requires authorization. You can try signing in or changing directories.
Access to this page requires authorization. You can try changing directories.
Overview: Displays CPU usage by process including the idle process which is disabled by default, as shown in the following screen shot.
Graph Type: Usage graph.
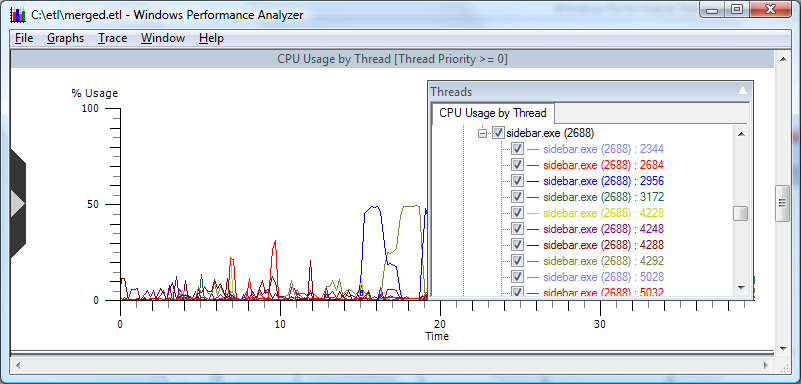
Y-axis Units: Percentage of CPU usage by thread
Required Flags: LOADER+PROC_THREAD +CSWITCH
Events Captured: Kernel and user mode Image Load/Unload, Process and Thread Create/Delete, CPU Sample Profile, Context Switch
Legend Description: Lists all threads that were active during the trace.
Graph Description: Displays data sampled by ETW at millisecond intervals. Specific CPU sampling can be selected by choosing CPU data series from the legend. Since the zero page thread is a kernel thread that is not actionable it is excluded from this display. Note that the data displayed on this graph is calculated by sampling CPU activity as opposed to the CPU Usage graphs that calculate the usage based on context switch events.
Selecting "Set Minimum Priority" in the context menu controls the processes shown based on priority. Changes to the priority filtering are reflected in the graph heading. For more information on setting a minimum priority please see theSet Minimum Priority Level in the Appendix of this document.