Note
Access to this page requires authorization. You can try signing in or changing directories.
Access to this page requires authorization. You can try changing directories.
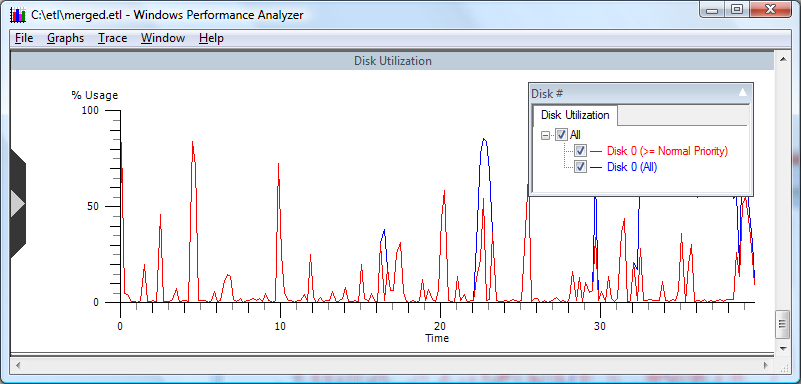
Overview: This graph displays disk activity aggregated by disk, as shown in the following screen shot.
Graph Type: Usage graph
Y-axis Units: Displays the percentage of disk throughput capacity being used at a given point in time.
Required Flags: DISK_IO
Events Captured: Disk I/O events
Legend Description: The legend reflects the disks currently recognized by the operating system as active.
Graph Description: A usage graph that displays disk activity aggregated by disk, broken down into greater than or equal to normal priority and all priorities. The Usage Percentage is computed by calculating the amount of time a disk is servicing I/O requests vs. the time spent idling. For information regarding the storage attached to the system at the start of the trace, choose the Trace menu and click System Configuration.