Note
Access to this page requires authorization. You can try signing in or changing directories.
Access to this page requires authorization. You can try changing directories.
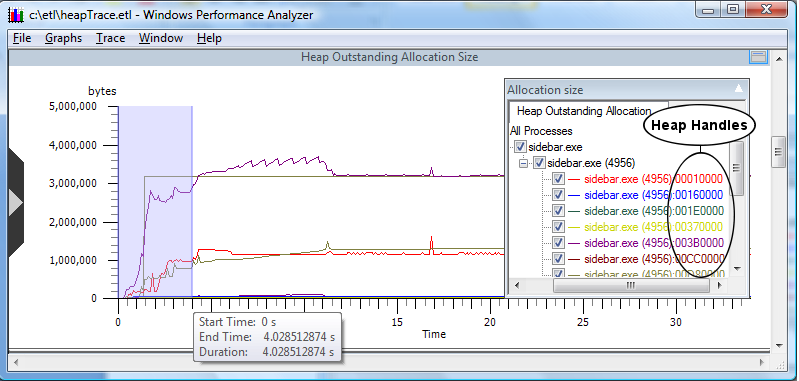
Left click and drag across the vertical time scale as displayed in Time interval selected. When satisfied with the time interval selection, release the mouse button. Right click and select zoom from the context menu. The graph will expand and show only the time interval selected, as in the following screen shot.
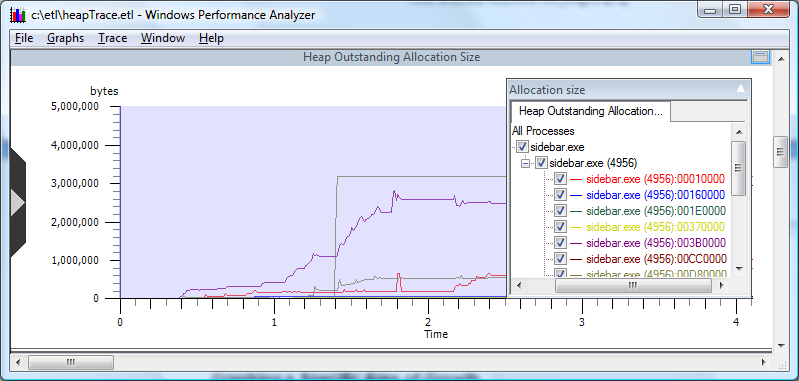
The following screen shot displays a graph showing the heap outstanding allocation size zoomed to the selected time interval.
For more information on formatting graphs please see the Graphs section of this document.