Reviewing Trace Event Information
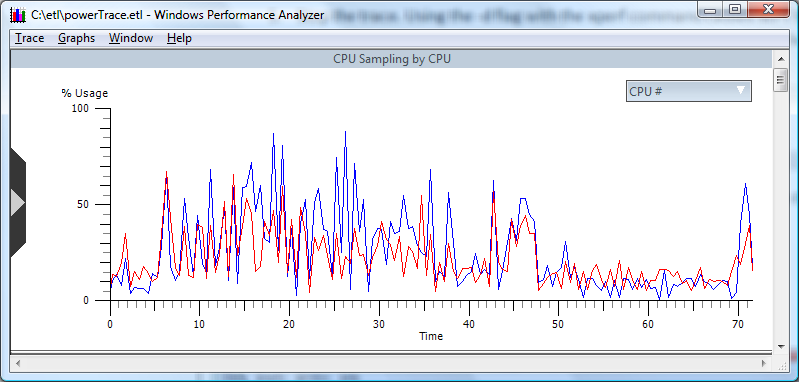
The following trace demonstrates CPU activity, as shown in the following screen shot:
To examine the P-state and C-state information contained in the trace, scroll through the various graph views. The P-state information is in the graph titled CPU Frequency, and the C-state information is in the graph titled CPU Idle States. By default, both graphs are shown, but if they do not appear, click the control on the left side of the xperf window to select them.