Note
Access to this page requires authorization. You can try signing in or changing directories.
Access to this page requires authorization. You can try changing directories.
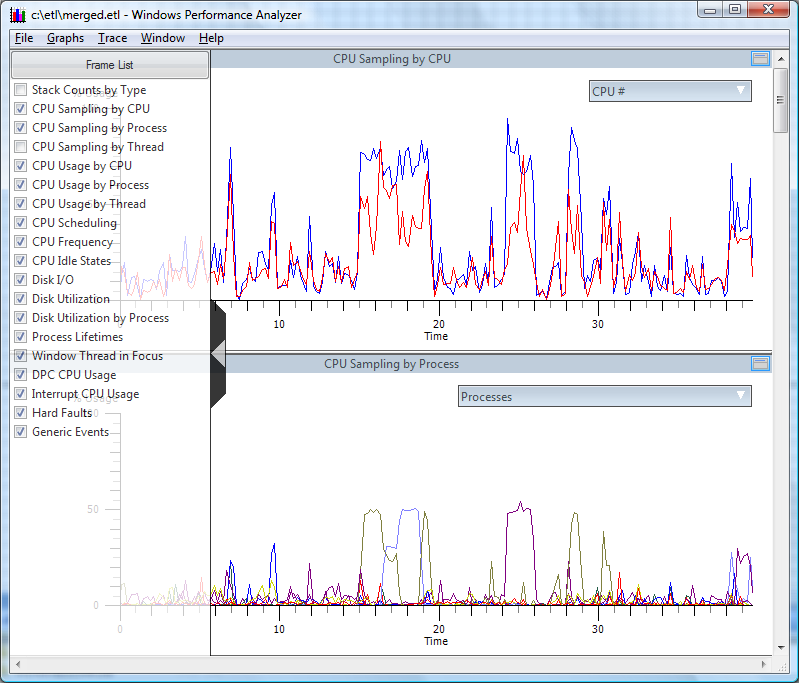
To select which graphs will be displayed click the chevron, located at the left side of the graph, to open the flyout list. This flyout list, shown in the following screen shot, contains a list of frames.

Each frame contains a single graph or multiple graphs. The frames displayed in the list depend on the event data captured and collated in the trace (.etl) file. For example, if the trace file contains process heap data, a collection of heap specific graphs is generated in addition to other data series from the trace file. Frames are selected by clicking the checkboxes. To scroll the window so that a particular graph is visible, double-click on the frame in the flyout list.
Initial graphs with Frame List open displays the first two default graphs created by WPA with the frame selection list open. To change the sequence that the graphs are presented, drag and drop the graph titles on the Frame List.
The Frame List is closed by clicking the chevron. Right clicking the chevron shifts the graphs so the Frame List will not cover the graph. Also, by right clicking the chevron, the Frame List is locked in the open position. The Frame List is unlocked by right clicking the chevron again.