To See How Much Time the CPU Spent at Each C-state
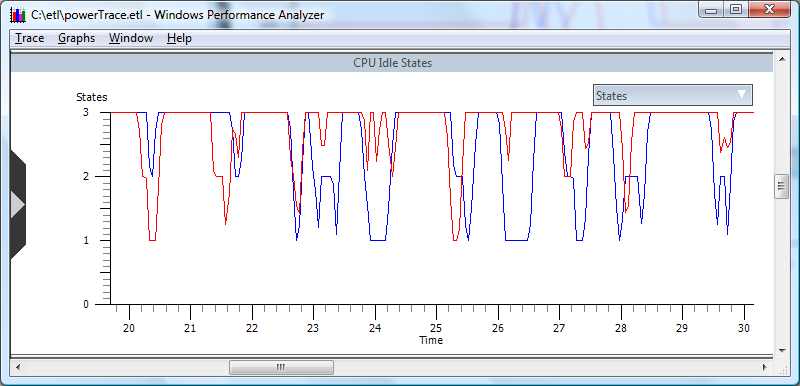
The CPU Idle States graph, as shown in the following screen shot, displays the target and actual C-states for a selected time interval.
To display the data in tabular form, right-click in the CPU Idle States graph area to select the entire view of the C-state graph and select Select View from the drop-down menu. After the entire graph is selected, right-click again and select Simple Summary. This Simple Summary table provides enough information to perform basic CPU idle state analysis by identifying these metrics, as in the following screen shot.
The Simple Summary provides the following data:
The amount of time the processor spent in C3, the lowest exposed C-state
The amount of time spent with the processor Active or in an intermediate C-state
If the processor family supports deeper C-states that are not exposed to the operating system, it is possible that the time shown spent in C3 may have been spent in even deeper C-states with lower power consumption.