Note
Access to this page requires authorization. You can try signing in or changing directories.
Access to this page requires authorization. You can try changing directories.
These articles explain how to debug a Xamarin.Android Wear application on an emulator.
Debug Wear on Emulator Overview
Developing Android Wear applications requires running the application, either on physical hardware or using an emulator or simulator. Using hardware is the best approach, but not always the most practical. In many cases, it can be simpler and more cost effective to simulate/emulate Android Wear hardware using an emulator as described below. If you are not yet familiar with the process of deploying and running Android Wear apps, see Hello, Wear.
Configure the Android Emulator
To run your Wear app on an emulator, you must install the Android SDK Android Emulator and configure it for Android Wear. For overall Android SDK Emulator installation and configuration information, see Android Emulator Setup.
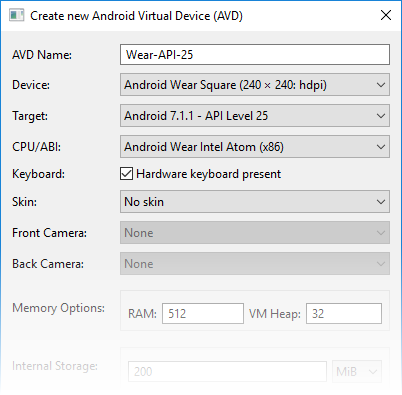
When you create a Wear virtual device, select an Android Wear device profile (such as Android Wear Square). For improved performance, use the Wear x86 CPU/ABI as seen in this example:
Launch The Wear Virtual Device
After you have created an Android Wear virtual device, you can choose it from the device pull-down menu in the IDE before you start debugging. If your virtual device is not available in the device pull-down, verify that your project is an Android Wear app project (not an Android app project) and that its target API level is set to the same API level as the virtual device. For example:
After the Android emulator starts, Xamarin.Android will deploy the Wear app to the emulator. The emulator runs the app with the configured virtual device image.
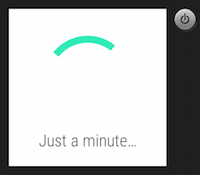
Don't be surprised if you see this (or another interstitial screen) at first. The watch emulator can take a while to start up:

The emulator may be left running; it is not necessary to shut it down and restart it each time the app is run.
Summary
This guide explained how to configure the Android Emulator for Wear development and launch a Wear virtual device for debugging.

