Reporting and Trends
Users can perform self-service reporting and trend analysis against their support information on the Support landing page.
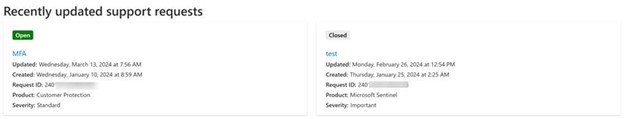
Underneath the blue banner is the Recently updated support requests section. Users can see their two most recently updated support requests in this section and understand their status and activity against them at a glance.
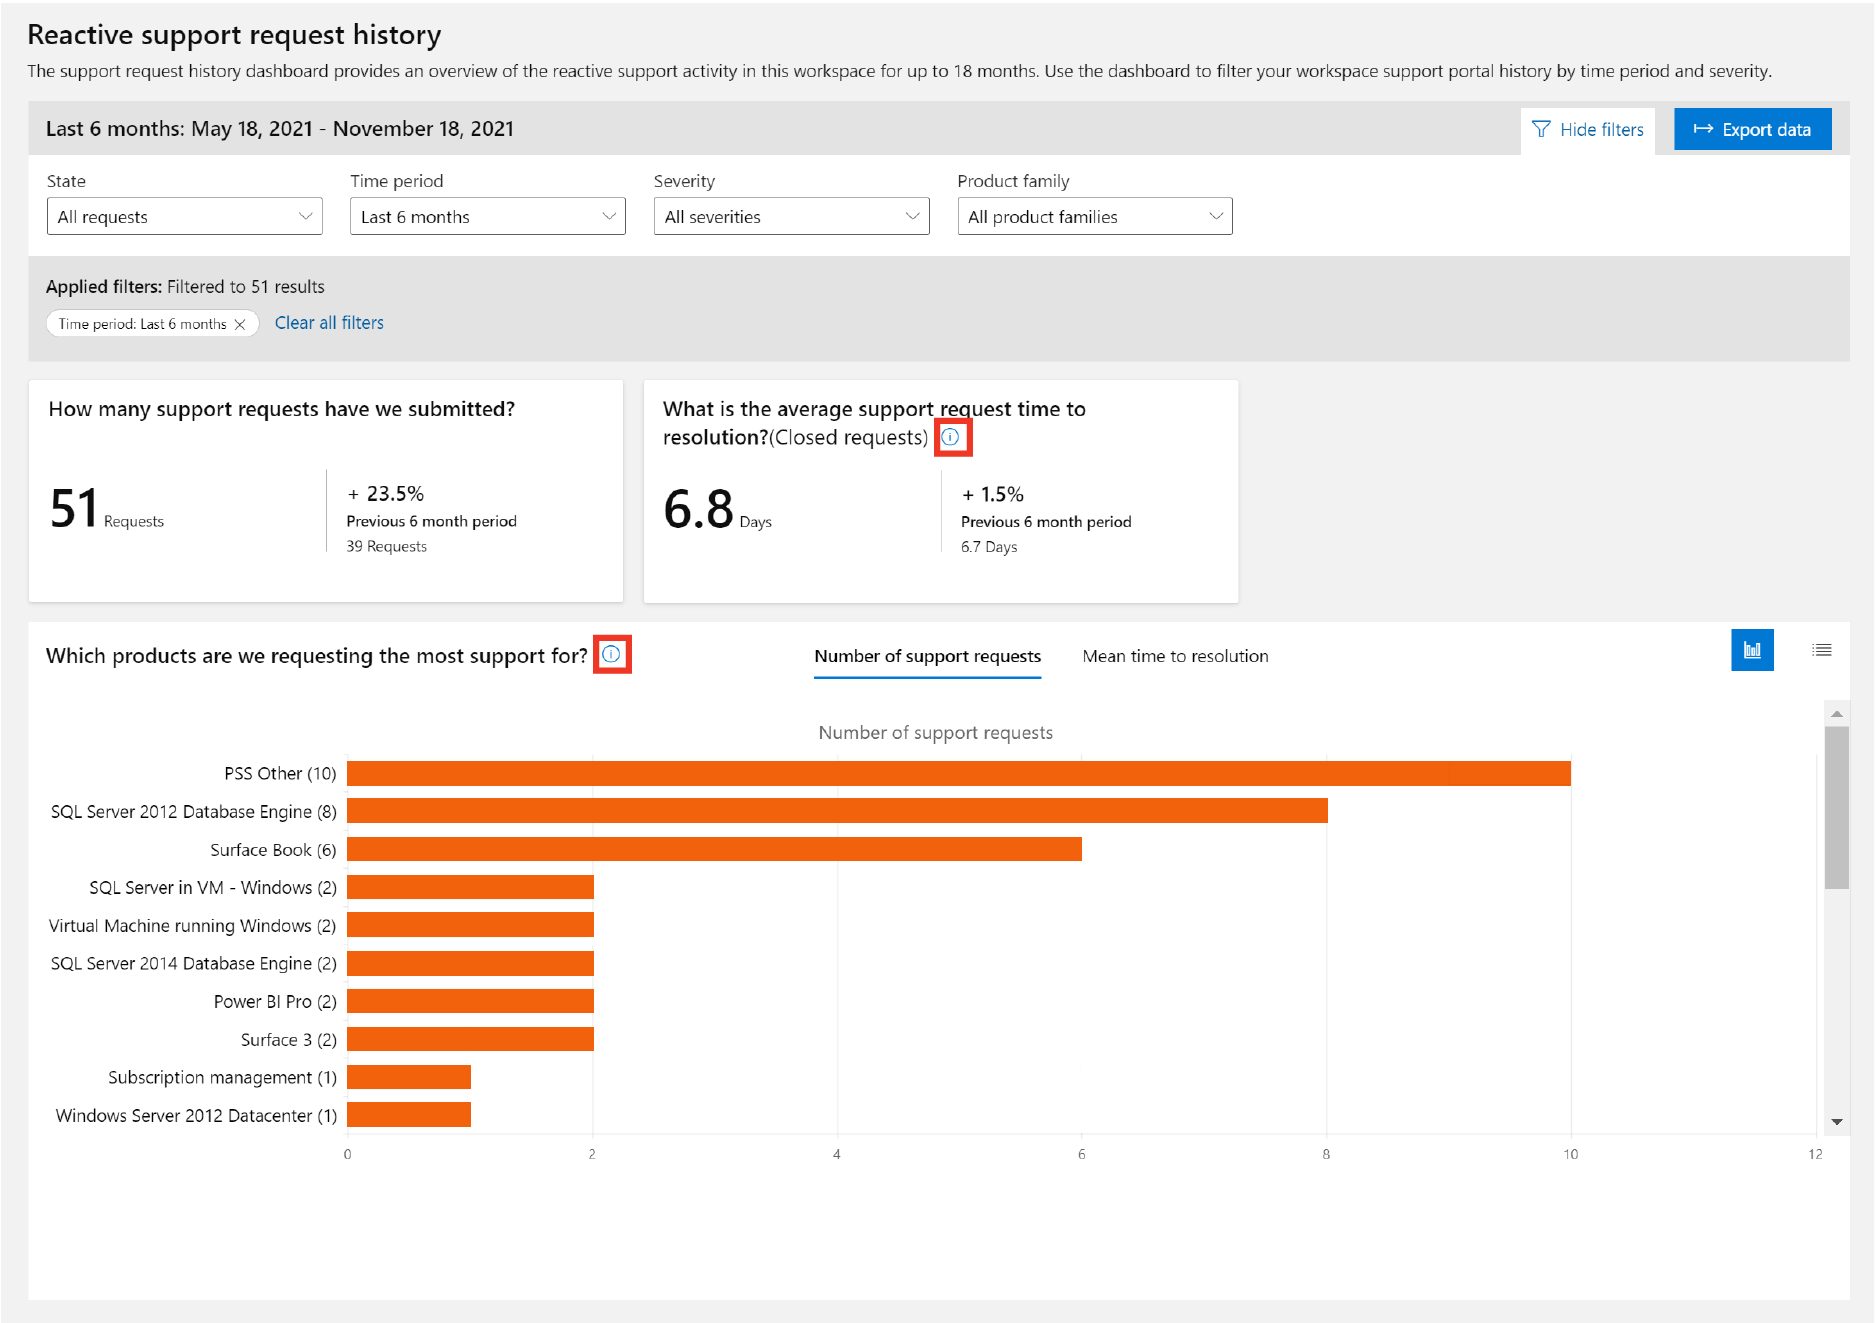
Next is the reactive support request history section, which displays a summarized view of your cases opened by product in your current workspace, going back the last 18 months. Filters on Case State, Time Period, Severity (Initial, Current, Max), and/or Product Family can be applied to drill into specific information in this section.
We've taken the top 3 most common questions that CSAMs get asked by you and turned them into filterable KPI tiles to help you understand:
- How many support requests have you submitted?
- See the total number of cases that you have submitted, as well as how your case submission has changed over the last time period.
- What is the average support request time to resolution?
- See the average time to resolution for your closed support cases up to the last 18 months. This excludes requests with unusually short or long times to closure, such as duplicate issues and bugs.
- Monitoring mean time to resolution drives relevant recommendations in the Services Hub, helps you to understand your reactive support use and activity, and empowers you to make decisions to meet your goals.
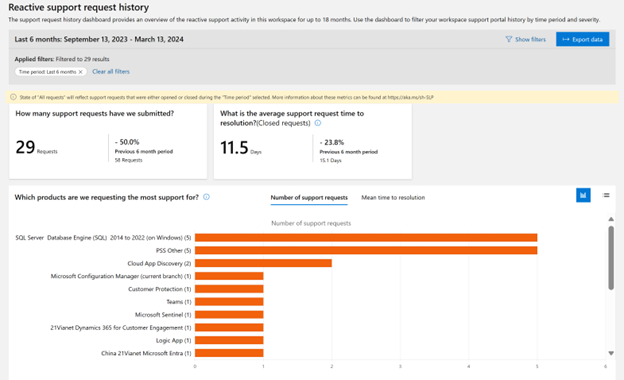
On the number of support requests histogram, users can understand which products they are requesting the most support for.
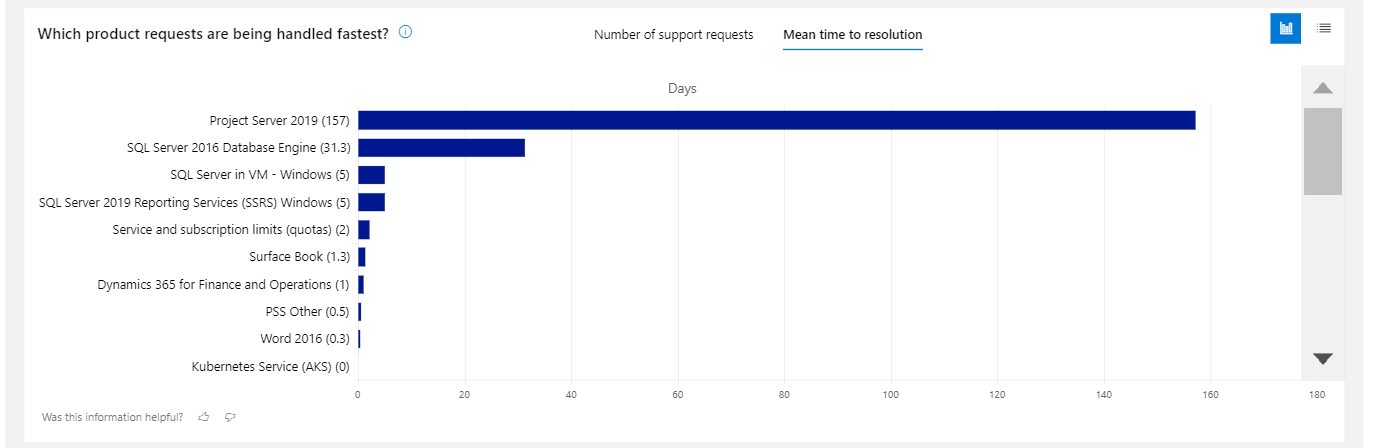
On the mean time to resolution histogram (MTTR), see the rate at which your support requests are being handled and resolved by product. This data come from support requests that have already been closed and excludes requests with unusually short or long times to closure, such as duplicate issues and bugs. This is calculated using your available support request data for the last 18 months.
Below is the reactive support request history section, which displays a summarized view of your cases opened by product going back the last 18 months. Filters on Case State, Time Period, Severity, and/or Product Family can be applied to drill into specific information in this section.

Users can toggle from the default histogram view to a table view by clicking on the table icon shown.
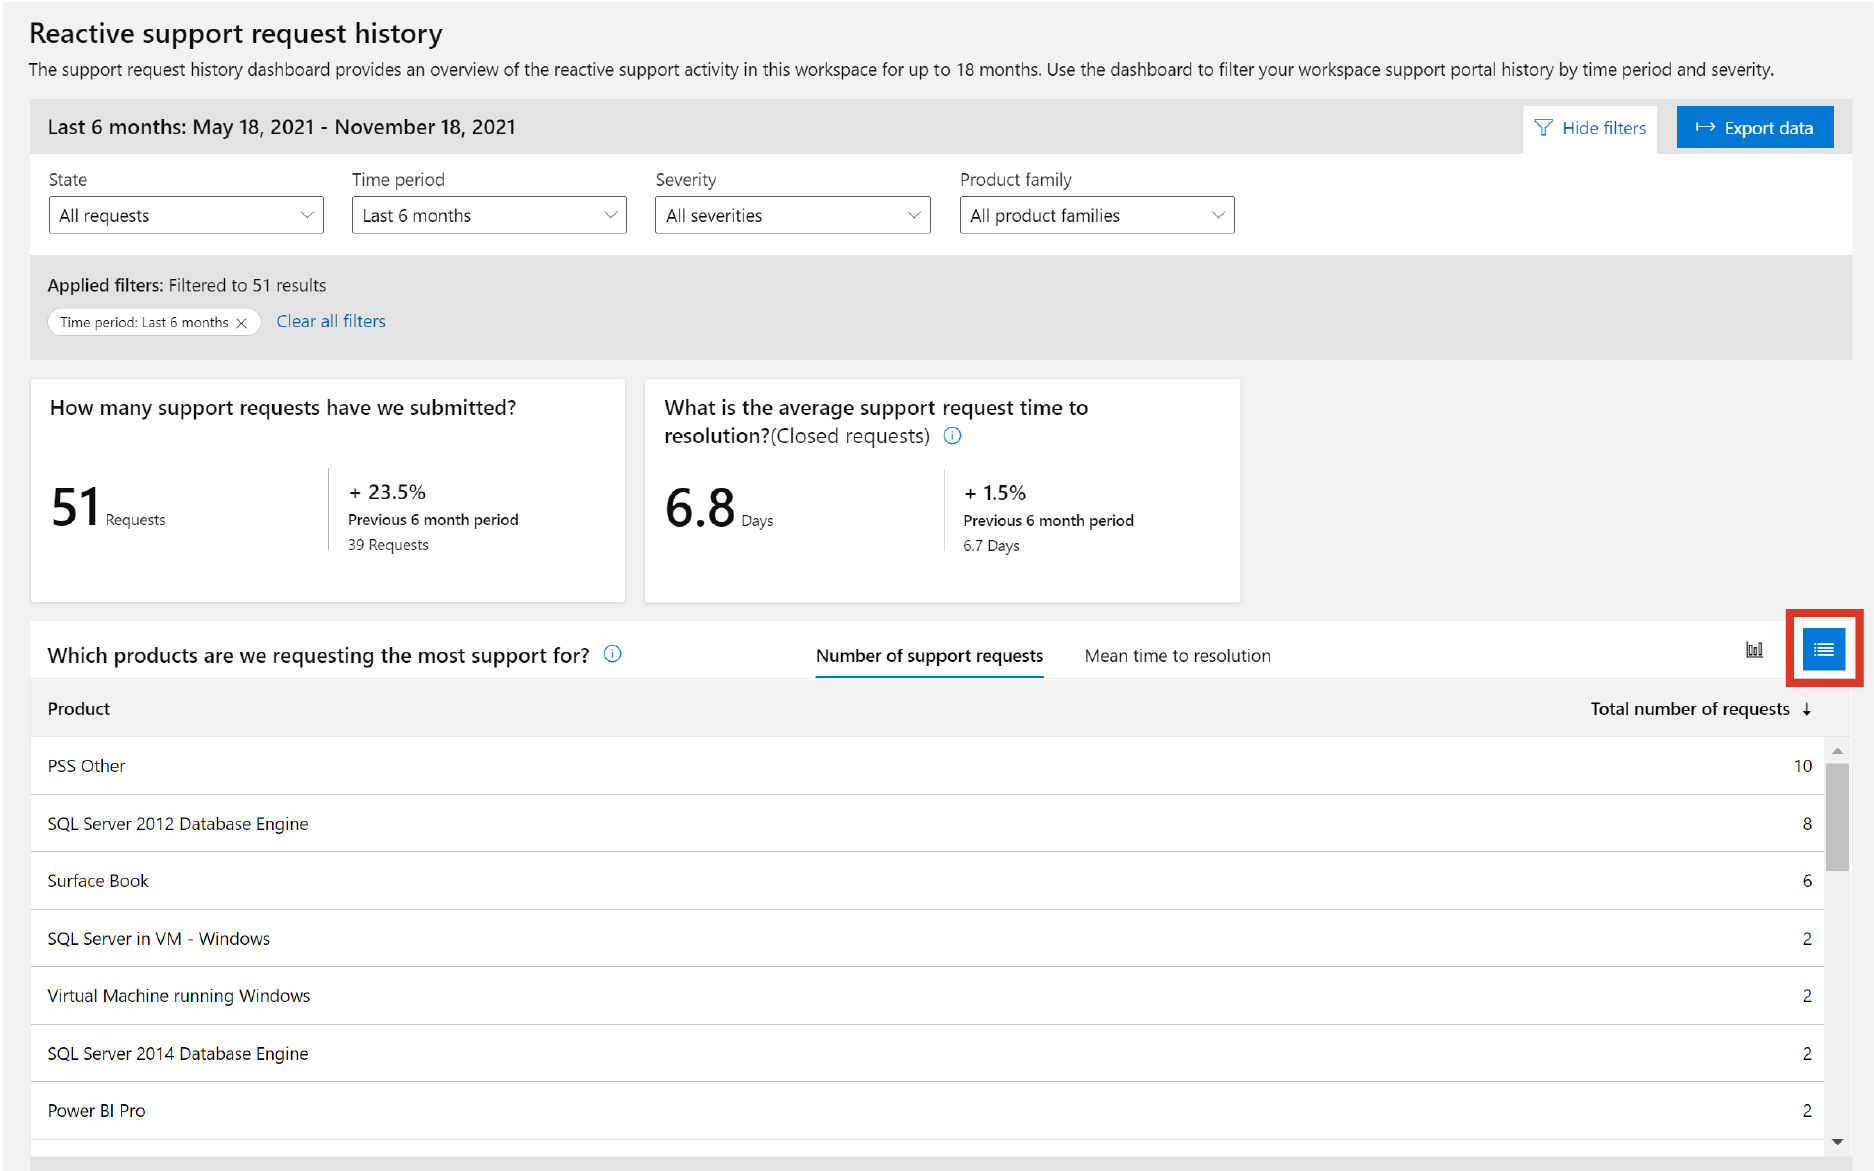
Users can click on the on-screen help tooltip shown below to get more a more detailed explanation of how this histogram is calculated and why it matters to the user.

Export Case Data
Customer users can export and download a copy of their case data from this reactive support request history frame by clicking the "Export data" button on the top right of the history section.
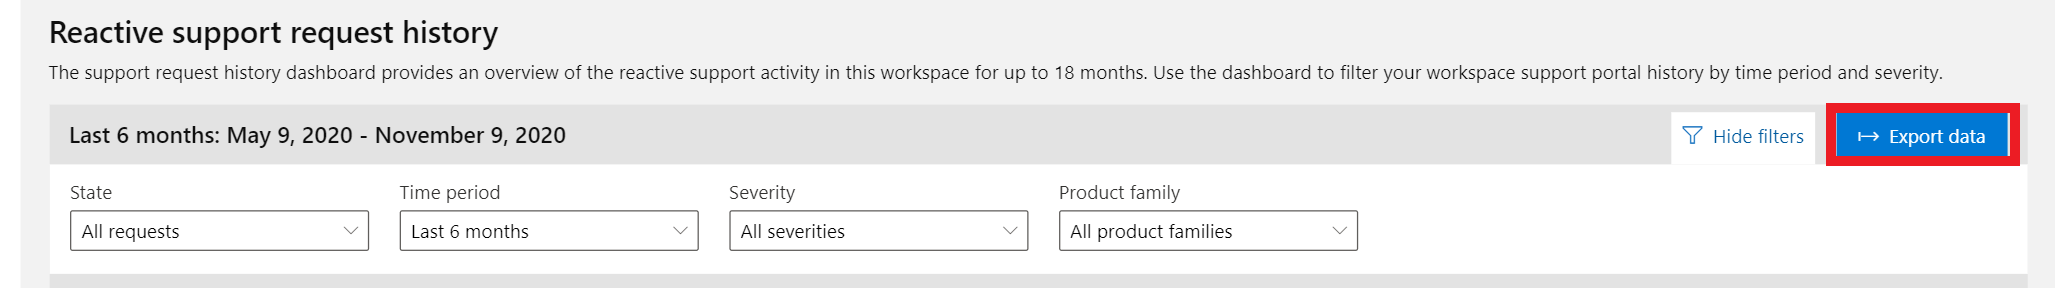
When you click on the “Export data button,” based on your selected filters, it will download a spreadsheet with the list of service requests that includes the following fields:
| Field | Example Data |
|---|---|
| Request ID | 2296XXX |
| Title | SharePoint notifications issue |
| State | Closed |
| Initial Severity | Important |
| Current Severity | Standard |
| Maximum Severity | Important |
| Product family | Office Products |
| Product | SharePoint Online |
| Support Request Owner | Marija Justina |
| Updated | Thursday, April 8, 2021, 11:57 AM |
| Created | Monday, April 5, 2021, 3:14 PM |
| Closed | Thursday, April 8, 2021, 11:58 AM |
| CritSit? | No |
| Closed within 14 Days | Yes |
| Closed within 24 Hours | No |
| Reopened | No |
| Office 365 Tenant ID | 22222222-2222-2222-2222-222222222222 |
| Azure Subscription ID | --- |
| Package Name | Company X PRS Hours |
| Package ID | 14166XXX |