Note
Access to this page requires authorization. You can try signing in or changing directories.
Access to this page requires authorization. You can try changing directories.
When debugging your SharePoint Framework components, you can get additional information about how they work and interact with other components on the page using the developer dashboard.
Developer dashboard is available on modern SharePoint pages and on the hosted and local SharePoint Workbench.
Open developer dashboard
To open the dashboard, on the keyboard press CTRL+F12. When the dashboard is open, to close it, press CTRL+F12 again.
Information available in the developer dashboard
The developer dashboard provides you with additional information about all SharePoint Framework components present on the page. This information helps you solve performance- and other problems in your SharePoint Framework solutions.
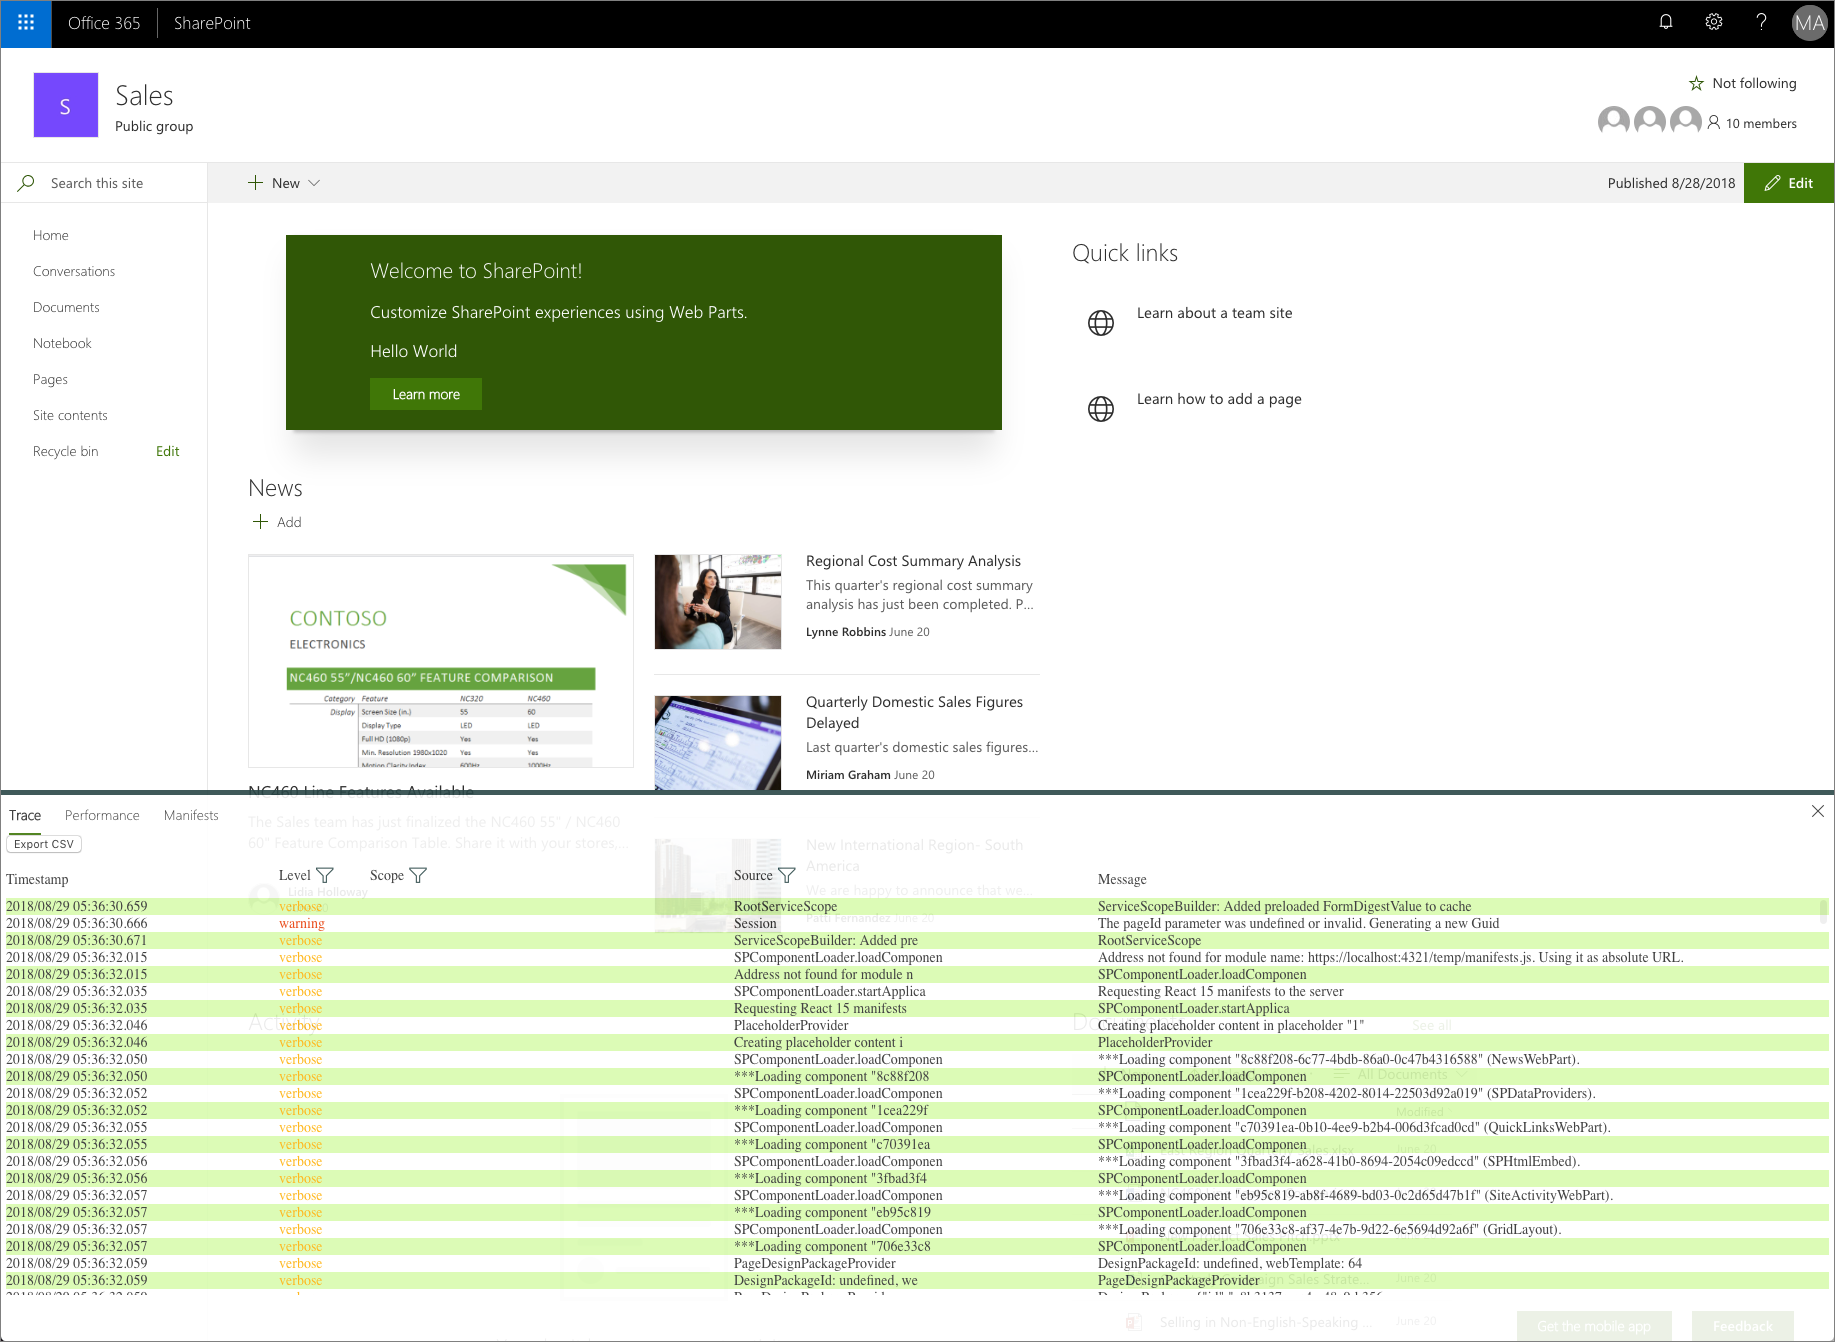
Trace
When building SharePoint Framework components, you can use the built-in logger to log information in your code. Logged messages will appear on the Trace tab in the developer dashboard.
Following, is how you would log a verbose message to the SharePoint Framework developer dashboard:
// [...] shortened for brevity
import { Log } from '@microsoft/sp-core-library';
const LOG_SOURCE: string = 'HelloWorldWebPart';
export default class HelloWorldWebPart extends BaseClientSideWebPart<IHelloWorldWebPartProps> {
public render(): void {
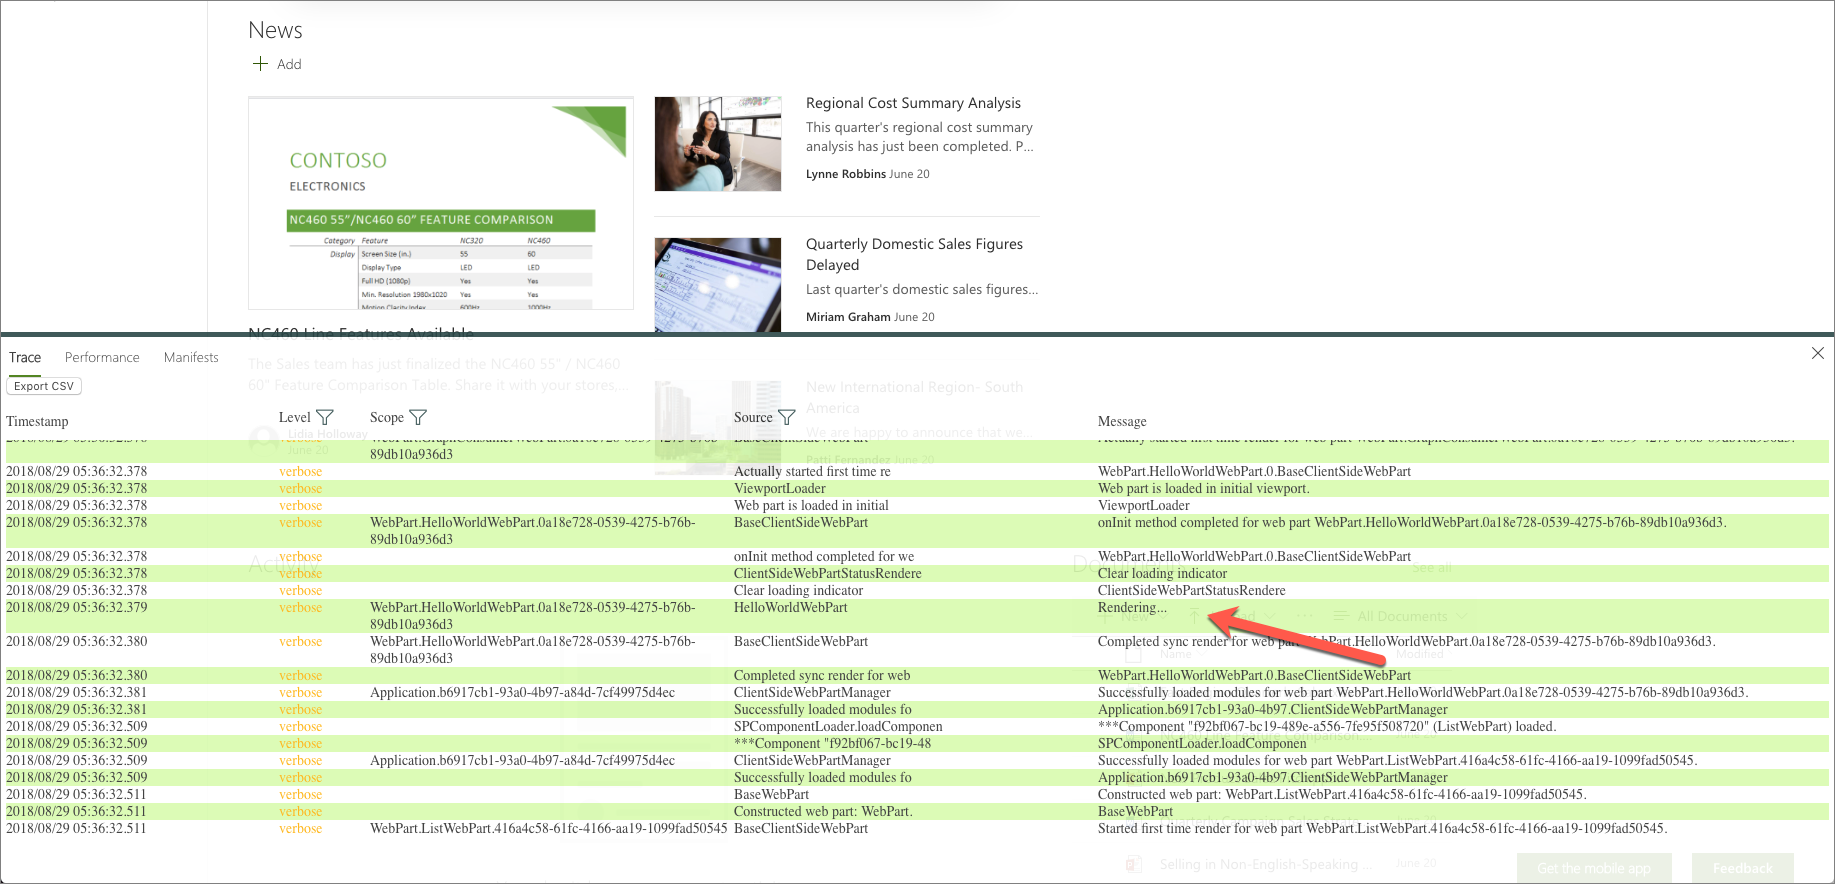
Log.verbose(LOG_SOURCE, 'Rendering...', this.context.serviceScope);
// [...] shortened for brevity
}
}
The logged message will appear in the developer dashboard.
Using the built-in logger, you can log verbose (Log.verbose()), information (Log.info()), warning (Log.warn()) and error (Log.error()) messages.
Important
Messages logged using the built-in SharePoint Framework logger are visible only in the developer dashboard and are lost after the page is refreshed. If you need a logging solution for use in production, consider using other solutions such as Azure Application Insights.
Performance
The Performance tab in the developer dashboard displays timing information for all SharePoint Framework components on the current page.
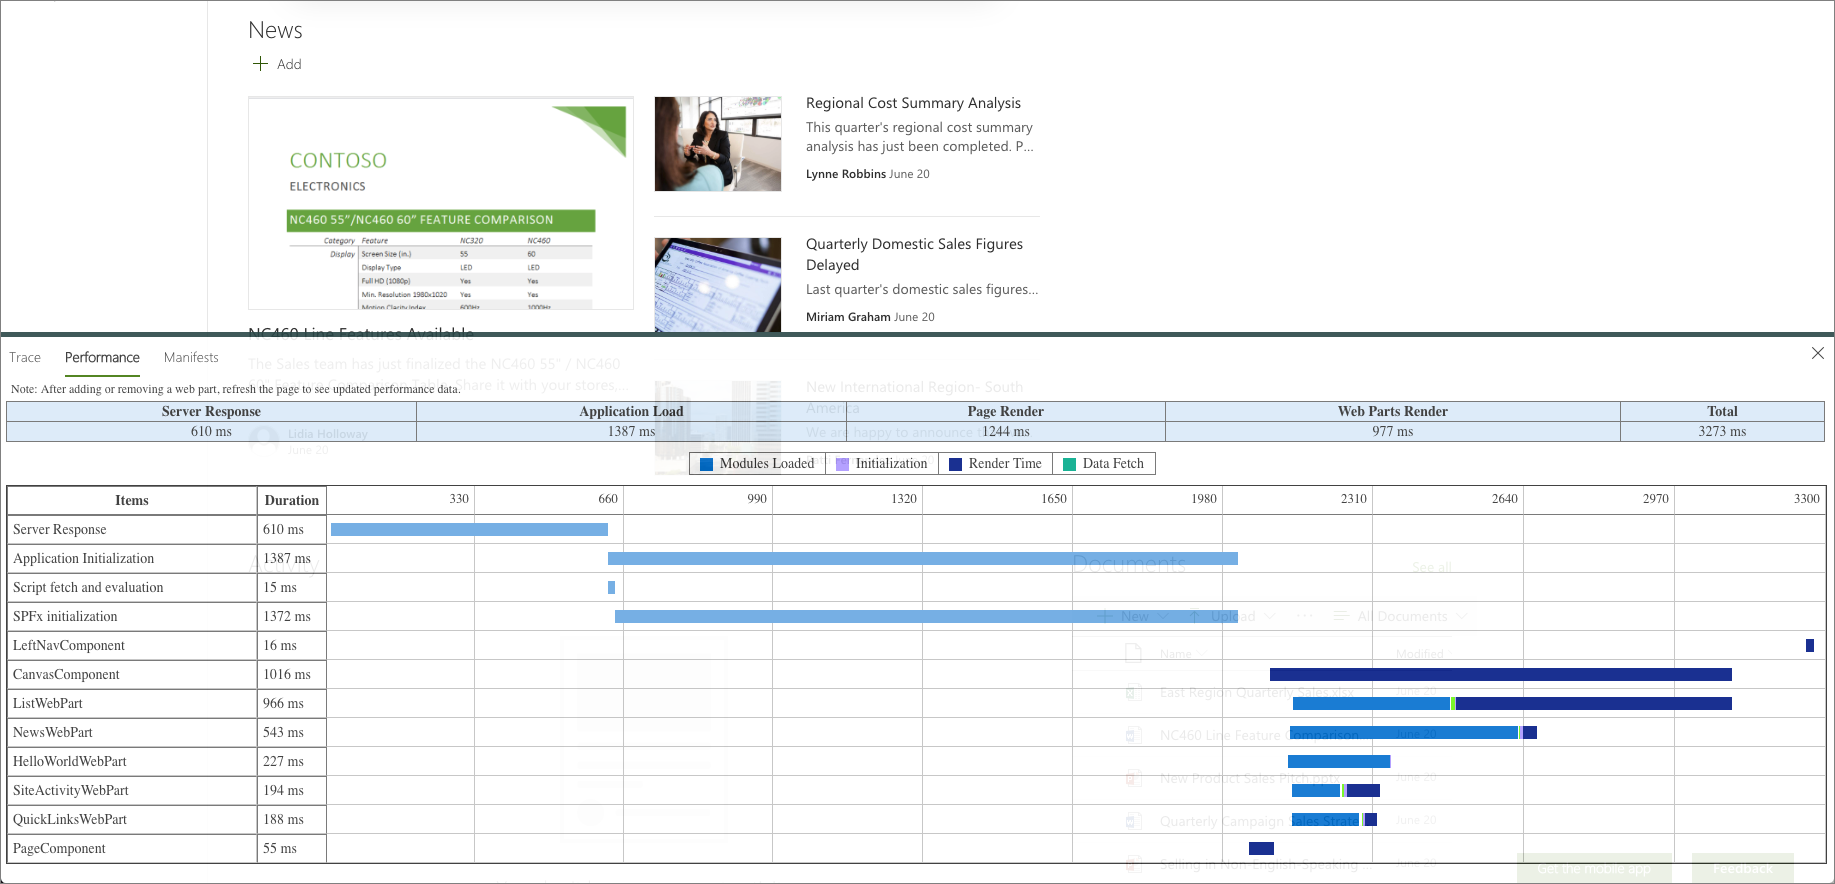
For each component, the developer dashboard shows how much time was spent on waiting on the response from the server, loading the module, initializing the component, retrieving the data, and rendering the component. If the page loads slower after adding your component to the page, you can use this information to verify if any particular stage in the lifecycle of your component is slowing down the page.
Manifests
The Manifests page in the developer dashboard shows information about the manifests of all SharePoint Framework components present on the current page.
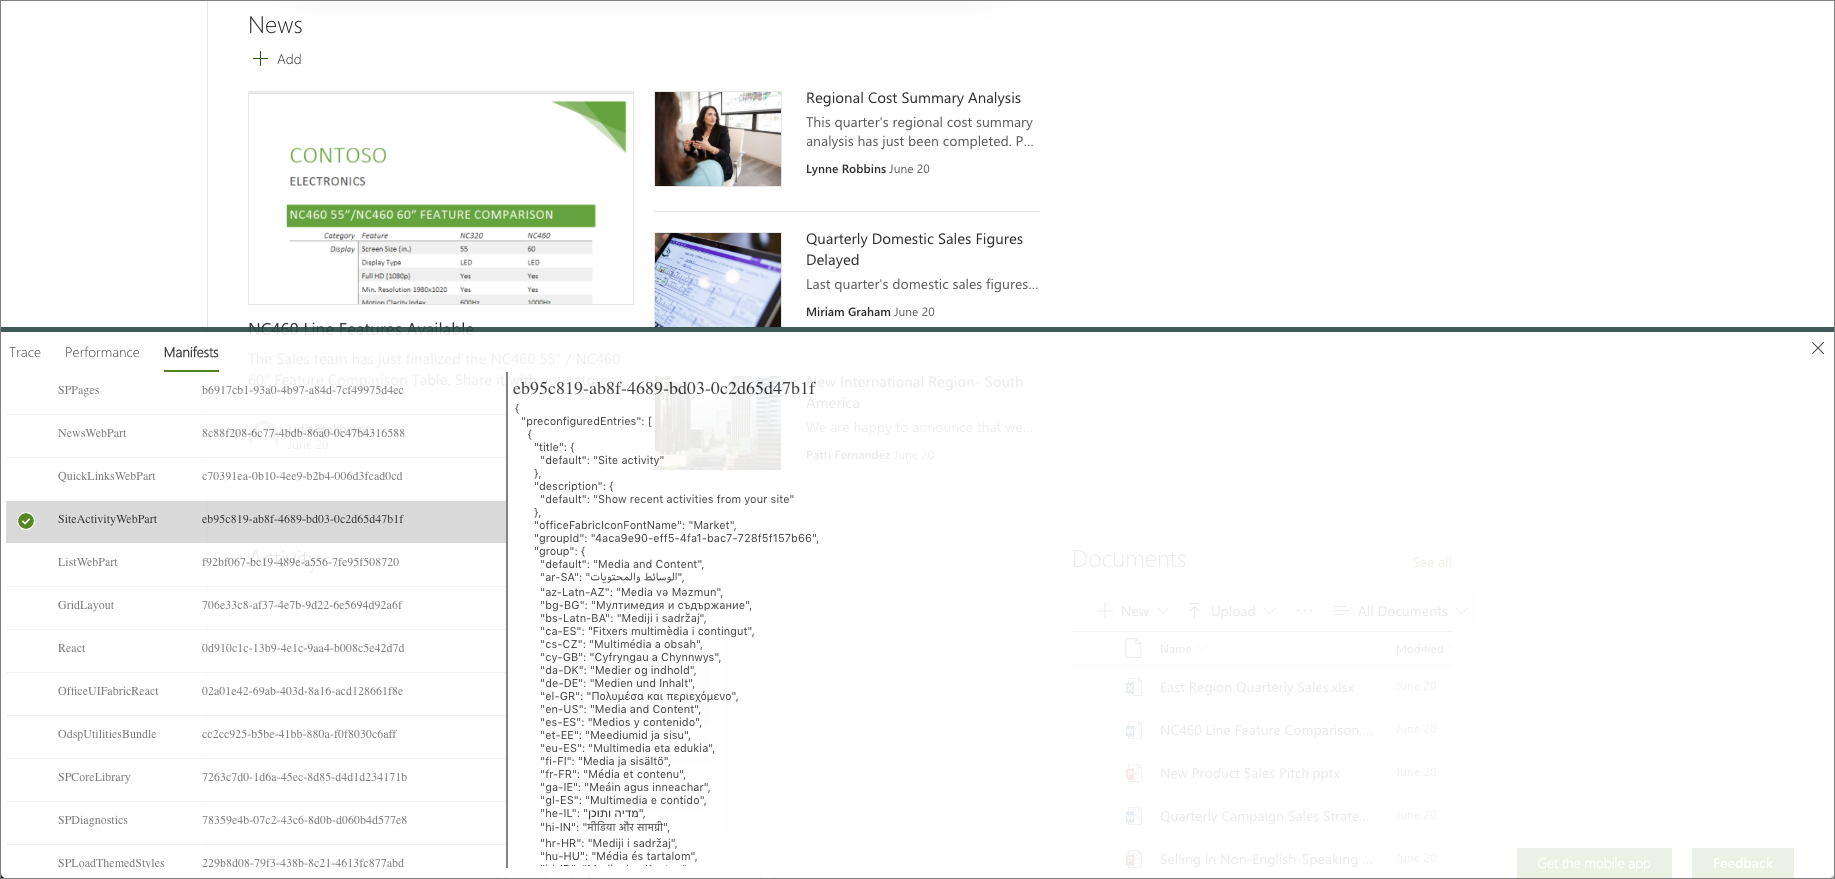
Using the information from the manifests you can verify what components are present on the page, which version of each component is being loaded and from which URL. This information is helpful if you need to ensure that your component was correctly updated and is loading from the right location with the right properties.