Use Call Quality Dashboard for Skype for Business Server
Summary: Learn about how to use the Call Quality Dashboard. Call Quality Dashboard is a tool for Skype for Business Server.
Call Quality Dashboard (CQD) allows IT Pros to use aggregate data to identify problems creating media quality issues by comparing statistics for groups of users to identify trends and patterns. CQD is not focused on solving individual call issues, but on identifying problems and solutions that apply to many users.
Call Quality Dashboard User Guide
CQD is a web portal for quickly creating and organizing reports based on Quality of Experience (QoE) data. CQD deploys an SSAS cube to aggregate the data in the QoE Metrics database, and enables admins to create and modify reports or do investigations in real time. While it is possible to use Excel to connect directly to the cube, the portal is optimized for several workflows involving QoE data. The data includes:
- Cached report data for fast access
- Deep links to report pages for information sharing and publishing
- Streamlined report editing and creation, and editable metadata for report descriptions.
Also, CQD exposes web APIs that give users programmatic access to the cube data for use in custom dashboards.
Feature Overview
When you visit the Call Quality Dashboard, you see the following screen:
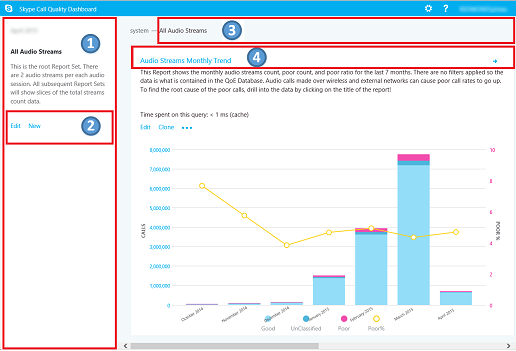
- The "Summary Pane" is where context for the "Report Set" (to the right) can be found.
- Click "Edit" in the Summary PaneReport to set level properties (including Y-axis height).
- The Breadcrumb helps you identify your current location within the report set hierarchy.
- Reports with subreports are shown with a blue link. Click the link to drill down to the child reports.
Move the mouse over the bar charts and trend lines to show detailed values. The report that has focus shows the action menu: "Edit", "Clone", "Delete", and "Download".
Default Reports
When you first access the Call Quality Dashboard portal, a default set of reports is automatically created. These reports are sometimes referred to as system reports. You are able to freely modify or delete these reports or extend them by creating new sibling and child reports.
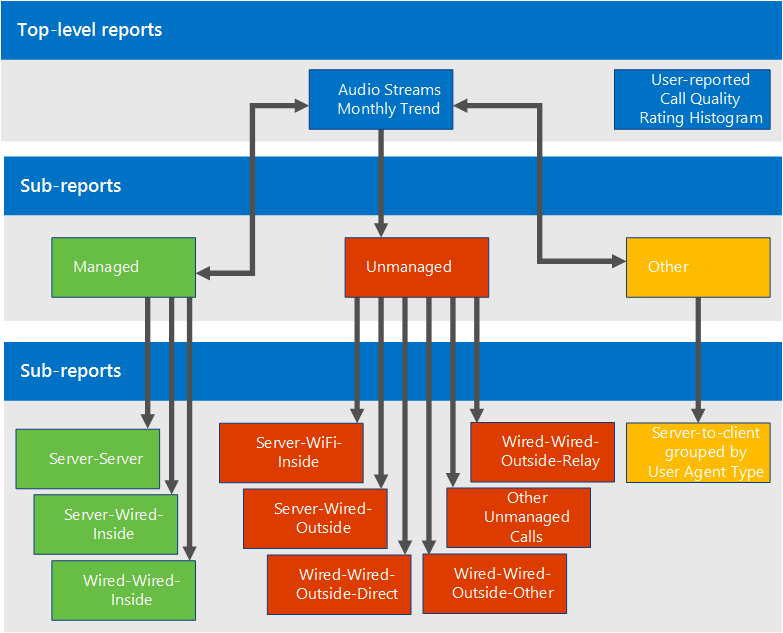
At the top level, the "Audio Streams Monthly Trend" report shows the monthly trend for all audio streams. Move the mouse over the bars in a bar chart to show a more detailed view of the data represented by the bar chart. Click the title of the Audio Streams Monthly Trend report to navigate to the "Managed vs Unmanaged Audio Streams" report, where the reports are split between Managed and Unmanaged calls. Managed calls are calls made from inside the corporate firewall over wired connections. Unmanaged calls include calls made from outside the corporate firewall and all calls made over Wi-Fi.
The other top-level report is called the "User-reported Call Quality Rating Histogram." Call Quality Ratings are the numbers given by Skype for Business users at the end of a call to indicate the quality of the call. The rating numbers range from 1 to 5, 1 is the worst and 5 is the best. The histogram shows the number of audio calls that had the indicated rating in one month.
Click the title of any of the reports to navigate into reports with more filters on the data. In the system reports, each child report displays a subset of the data available in its parent report. The problem-solving model is simple: investigate which subreport the data or trend suggesting a problem is confined to, and gradually narrow down the problem space. The ability to create subreports allows you to investigate your own guesses about the cause of specific data trends.
Create and Edit Reports
Click "Edit" in the action menu of a report to see the Report Editor. Each report is backed by a query into the cube. A report is a visualization of the data returned by its query. The Report Editor helps you edit these queries and the display options of the report. When you open the Report Editor, you see:
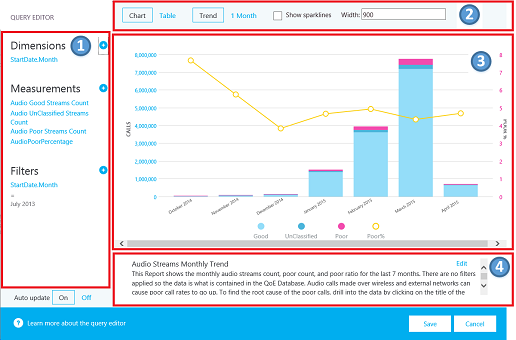
- Dimensions, measures, and filters are chosen in the left pane. Hover over one of the existing values to show an "x" button that allows the value to be removed. Click the "plus" button next to a heading to open the dialog where you can add a new dimension, measure, or filter.
- Options for chart customization are displayed at the top.
- A preview of the report is available in the Report Editor.
- A detailed report description can be created with the edit box at the bottom.
Sparklines in Tables
When StartDate.Month is added as a dimension and the data is rendered as a trend in table form, bar charts and sparklines can be shown inside the table cells. Move the mouse pointer over the bar chart and the sparklines to show the values for individual months.
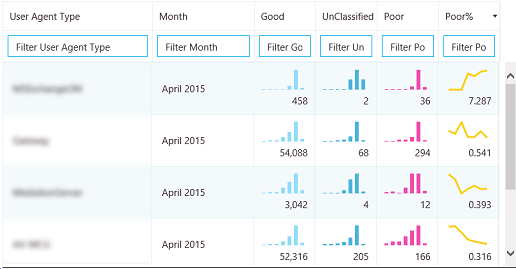
In order for the bar charts and the sparklines to appear, the "Show sparklines" checkbox at the top of the Report Editor must be checked. This selects the Trend option and moves Month down to be the last dimension, which can also be accomplished by clicking on Month and using the up and down arrows to shift StartDate.Month up or down.
Settings
The settings menu contains links to useful pages like the System Health and About pages, and is located in the top-right corner of the dashboard.
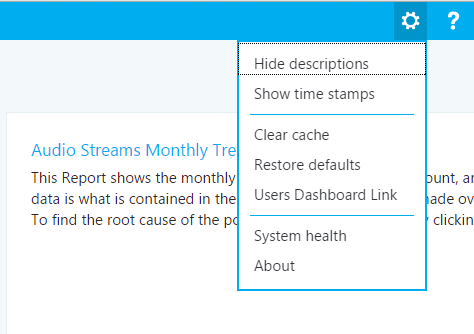
Whether to show descriptions and time stamps is up to individual users, and these settings only affect the individual's version of the dashboard, and do not modify the report set or what other users see. Clearing the cache causes all queries to reload their data from the cube, while restoring defaults deletes all of user-created or modified reports and recreates the system report set — what a user would see when they log in for the first time.
The Users Dashboard Link shows a page where users can view other users of CQD and browse their reports. To share a report set, copy the link in the URL bar and share it with another CQD user. This link is the same link other users would see in the Users Dashboard Link page under the user's username.
Supplying Subnet Information
Additional information can be revealed if site-specific information is entered into the Archive database to provide subnet-to-building mapping information (for example, wired/wireless call quality by building).
At a minimum, complete the following tables to create these reports:
- CqdBuilding
- CqdNetwork
Additional information can be provided in CqdBuildingType and CqdBuildingOwnershipType tables to allow further filtering and drill-down.
The data used for these tables are defined as follows:
CqdBuilding
| Column | Data Type | Allow Nulls? | Details |
|---|---|---|---|
| BuildingKey | int | No | Primary key for the CqdBuilding table. |
| BuildingName | varchar(80) | No | Building name. |
| BuildingShortName | varchar(10) | No | Shorter version of the Building name. |
| OwnershipTypeId | int | No | Foreign key, matches one of the entries in the CqdBuildingOwners table. |
| BuildingTypeId | int | No | Foreign key, matches one of the entries in the CqdBuildingType table. |
| Latitude | float | Yes | Latitude of the building. |
| Longitude | float | Yes | Longitude of the building. |
| CityName | varchar(30) | Yes | City name where the building is located. |
| ZipCode | varchar(25) | Yes | Zip code where the building is located. |
| CountryShortCode | varchar(2) | Yes | ISO 3166-1 alpha-2 codes for the country where the building is located. |
| StateProvinceCode | varchar(3) | Yes | Three-letter abbreviation for the State/Province where the building is located. |
| InsideCorp | bit | Yes | Bit indicates whether the building is part of the corporate network. |
| BuildingOfficeType | nvarchar(150) | Yes | Description of the building office type. |
| Region | varchar(25) | Yes | Region where the building is located. |
CqdNetwork
| Column | Data Type | Allow Nulls? | Details |
|---|---|---|---|
| Network | varchar(25) | No | Subnet address. |
| NetworkRange | tinyint | Yes | Subnet mask. |
| NetworkNameID | int | Yes | Optionally maps to a row in CqdNetworkName table. |
| BuildingKey | int | Yes | Foreign key, matches one of the entries in the CqdBuilding table. |
| UpdatedDate | datetime | No | Datetime for when the entry was last updated. |
By default this next table has one entry (0, 'Unknown').
CqdBuildingType
| Column | Data Type | Allow Nulls? | Details |
|---|---|---|---|
| BuildingTypeId | int | No | Primary key for the CqdBuildingType table. |
| BuildingTypeDesc | char(18) | No | Building type description. |
By default this next table has one entry (0, 'Unknown', 0, null).
CqdBuildingOwnershipType
| Column | Data Type | Allow Nulls? | Details |
|---|---|---|---|
| OwnershipTypeId | int | No | Primary key for the CqdBuildingOwnershipType table. |
| OwnershipTypeDesc | varchar(25) | No | Ownership type description. |
| LeaseInd | tinyint | Yes | Index referencing another row in the CqdBuildingOwnershipType table, used for identifying leased buildings. |
| Owner | varchar(50) | Yes | Building owner. |
By default this next table has one entry (0, 'Unknown', 0, null).
CqdBssid
| Column | Data Type | Allow Nulls? | Details |
|---|---|---|---|
| bss | nvarchar(50) | No | Primary key for the CqdBssid table. Is the BSSID of the WiFi Access Point. |
| ess | nvarchar(50) | Yes | Wifi Access Point Controller information. |
| phy | nvarchar(50) | Yes | Phy information. |
| ap | nvarchar(50) | Yes | Wifi Access Point Name. |
| Building | nvarchar(500) | Yes | The Building Name the WiFi Access Point is located in. |
CQD Streams
A CQD stream is considered good, poor, or unclassified. CQM 1.5 now uses the following CQD definition:
- A poor stream is any combination of the poor call metrics beyond threshold.
- When one stream in a call is poor, both streams of the call are flagged poor. In conferences, each participant is counted as a unique call and is reported on independently of all others.
- Unclassified streams are streams without quality metrics (that is, Synthetic Transactions or short calls).
- Valid Streams = non-mobile clients
- Classifier cannot be modified
Poor call definition/classifier
| Metric | Threshold |
|---|---|
| DegradationAvg | Greater than 1.0 (-1 network MOS) |
| RoundTrip | Greater than 500 |
| PacketLossRate | Greater than 0.1 (10%) |
| JitterInterArrival | Greater than 30 |
| RatioConcealedSamplesAvg | Greater than 0.07 |
JPDR definition = Poor call definition minus RatioConcealedSamplesAvg
Where is Caller/Callee?
CQD doesn't use Caller/Callee fields, instead it uses "First" and "Second" because there are intervening steps between the caller and callee.
First Will always be the Server endpoint (for example, AV MCU or Mediation Server) if a Server is involved in the stream.
Second Will always be the Client endpoint, unless it is a Server-Server stream.
Example of First and Second classification
| Endpoint 1 UAType | Endpoint 2 UUAType | First | Second |
|---|---|---|---|
| 2 (AVMCU) | 4 (Skype for Business) | Endpoint 1 | Endpoint 2 |
| 2 (AVMCU) | 1 (mMediationServer) | Endpoint 2 | Endpoint 1 |
| 4 (Skype for Business) | 4 (Skype for Business) | The Caller in MediaLine | The Callee in MMediaLine |
If both endpoints are the same type, CQD makes the Caller entry First and the Callee Second. For more information about endpoint names, see this blog.
Accounting for VPN
If VPN solution is known to accurately set VPN flag, you're all set. Otherwise, use one of the following methods:
- Create a Network Type called VPN (preferred), then Associate VPN Subnets with this new VPN NetworkType.
- Create a building called VPN, then Associate VPN Subnets with this building.
Query Fundamentals
A well-formed query contains all three of these parameters:
- Measurement
- Dimension
- Filter
An example of a well-formed query would be "Show me Poor Streams [Measurement] by Subnet [Dimension] for Building 6 [Filter]."
What does UNION do?
Union allows you to filter conditions with the AND operator. There are scenarios where you can combine multiple Filter conditions together to achieve a result similar to an OR operation.
Example: To get all streams from a building, UNION provides a distinct view of the merged dataset. To use the UNION, insert common text into the UNION field on the two filter conditions you want to UNION.
Default Report Breakdown
If Wireless is managed internally, you can recreate the Wireless reports in the Managed bucket.
Operational Processes
Review and remediate Managed Streams first. Quality in this area should be 100% within your control and therefore easiest to remediate.
Managed Streams
Review and remediate managed streams in the following order:
- Server-Server
- Server-Wired-Inside
- Wired-Wired-Inside
Unmanaged Streams
Review and remediate unmanaged streams in the following order:
- Server-Wifi-Inside
- Server-Wired-Outside
- Server-Wifi-Outside
- Wired-Outside-Direct
- Wired-Outside-Relay
- Other Unmanaged