SQL Server Profiler extension (Preview)
The SQL Server Profiler extension (preview) provides a simple SQL Server tracing solution similar to SQL Server Management Studio (SSMS) Profiler except built using Extended Events. SQL Server Profiler is easy to use and has good default values for the most common tracing configurations. The UX is optimized for browsing through events and viewing the associated Transact-SQL (T-SQL) text. The SQL Server Profiler for Azure Data Studio also assumes good default values for collecting T-SQL execution activities with an easy to use UX. This extension is currently in preview.
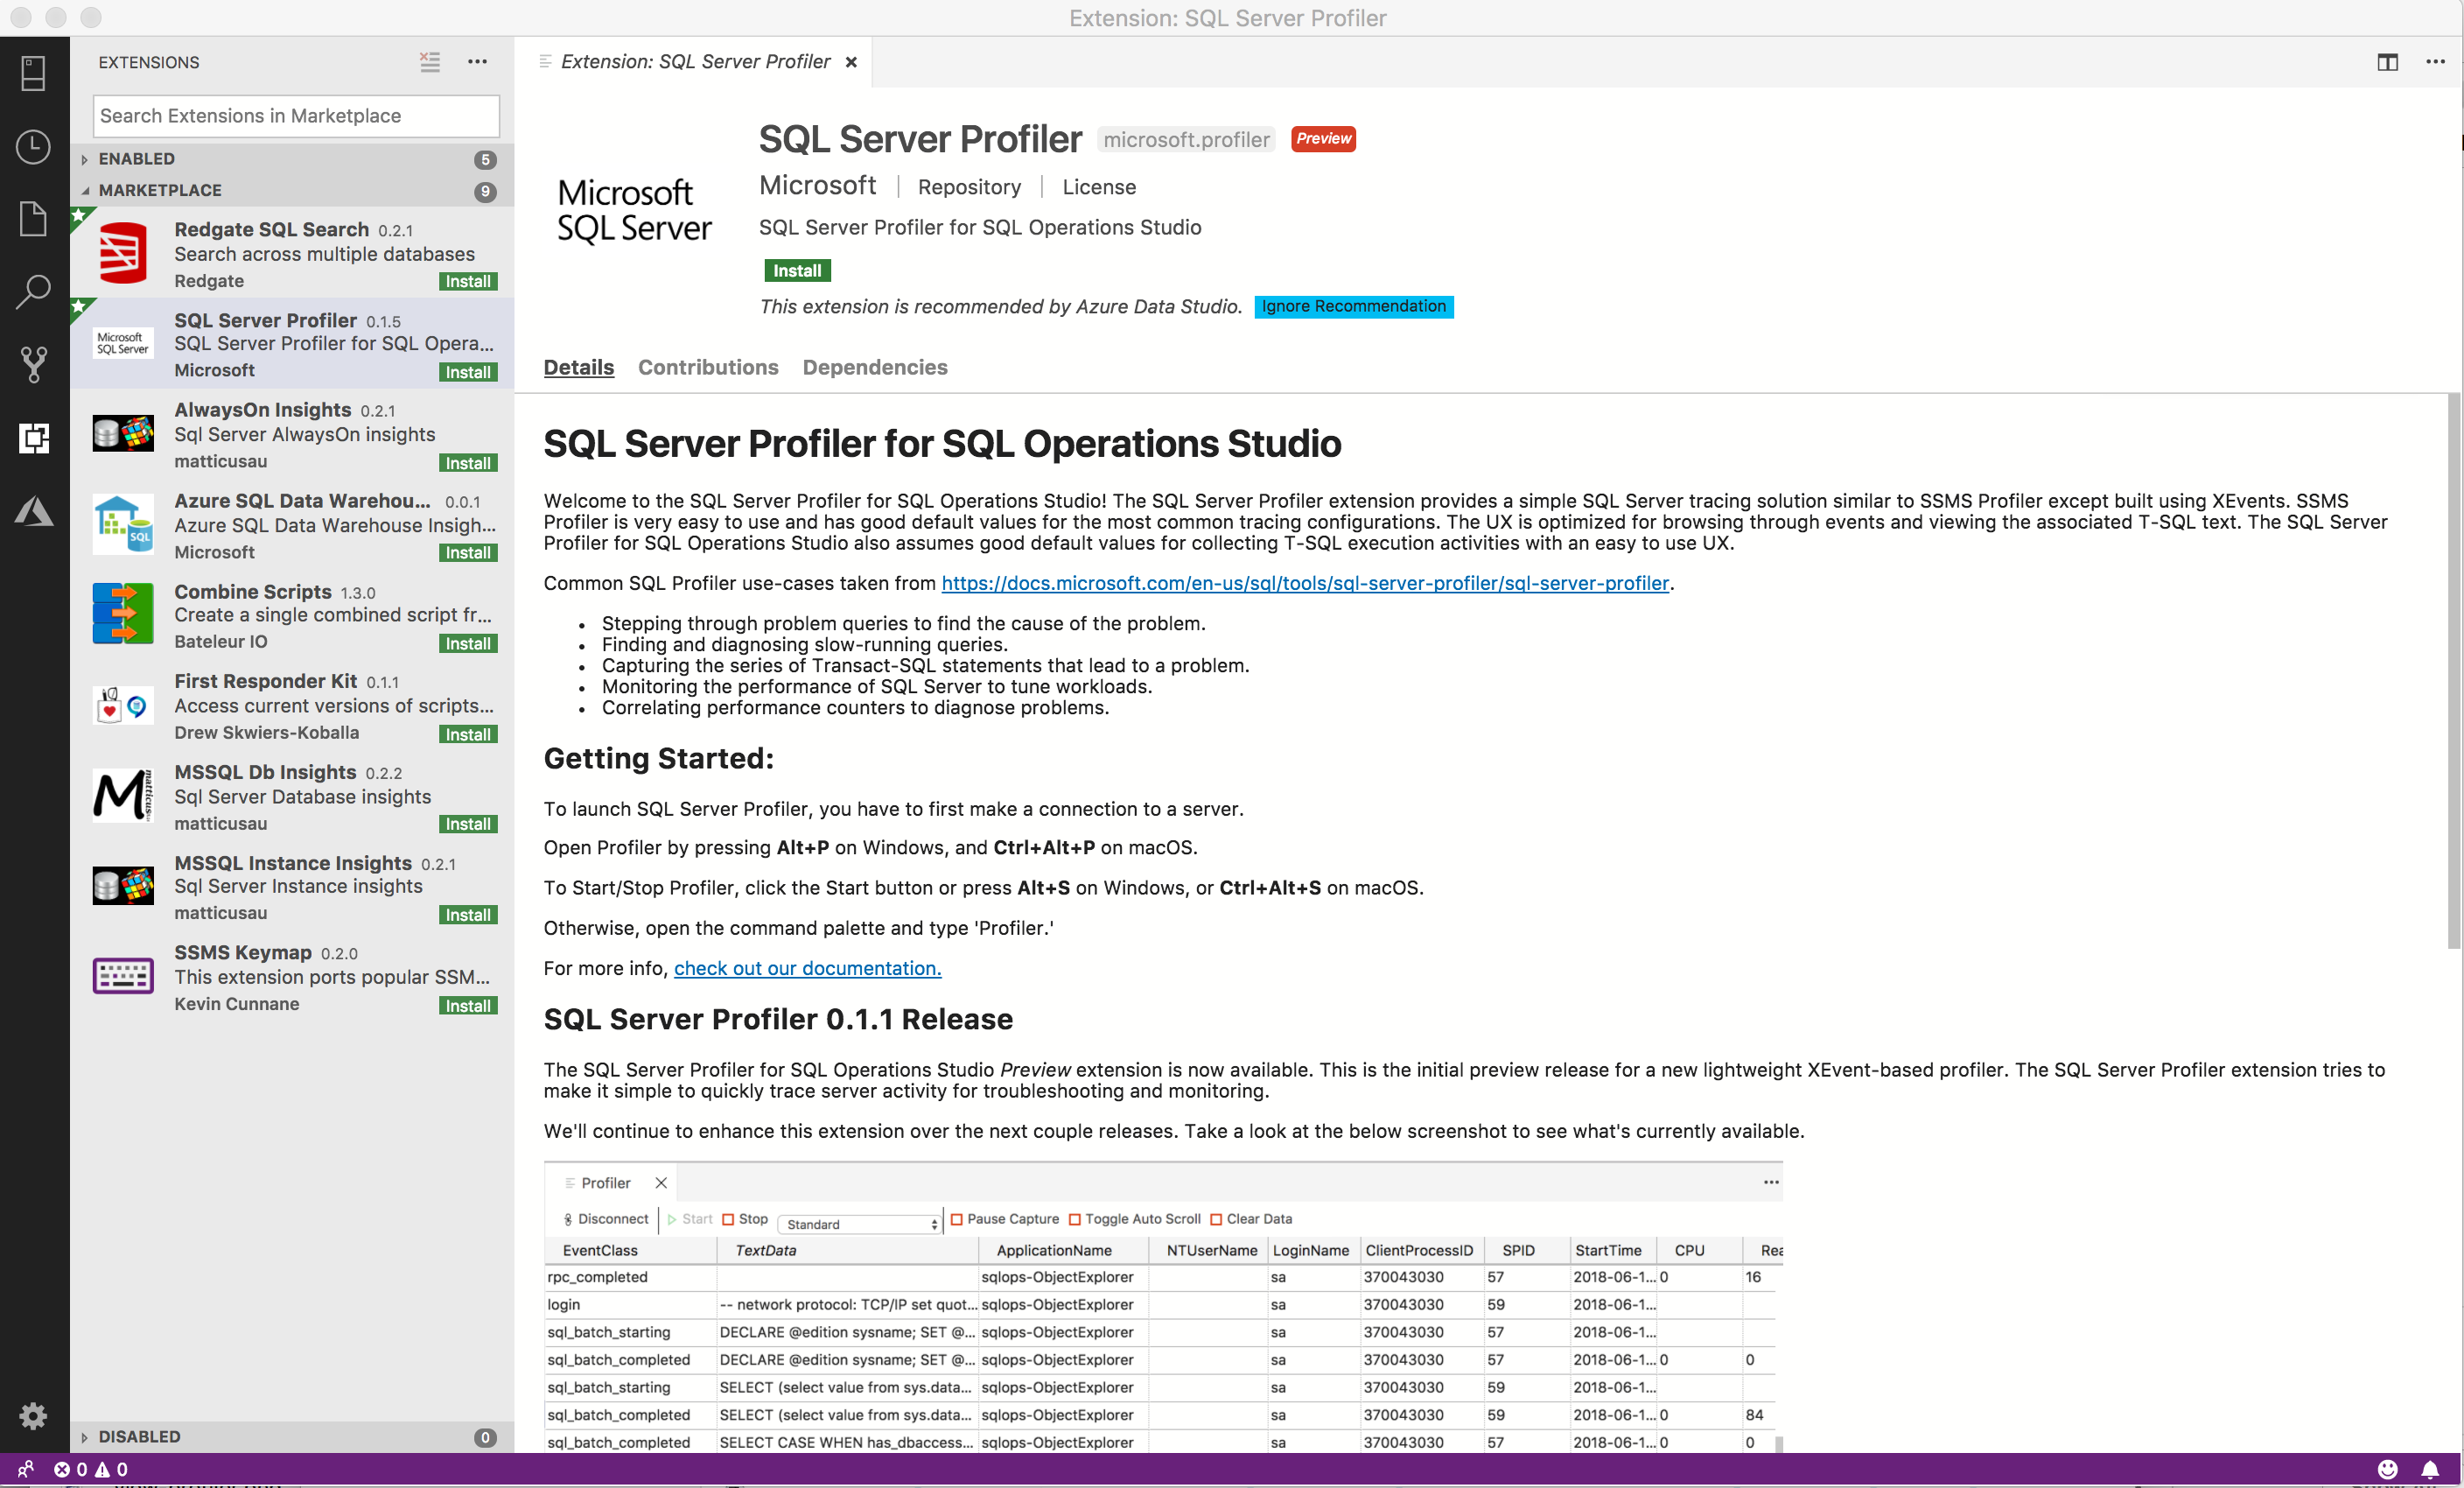
Common SQL Profiler use-cases:
- Stepping through problem queries to find the cause of the problem.
- Finding and diagnosing slow-running queries.
- Capturing the series of Transact-SQL statements that lead to a problem.
- Monitoring the performance of SQL Server to tune workloads.
- Correlating performance counters to diagnose problems.
- Opening an existing XEL file for review.
Install the SQL Server Profiler extension
To open the extensions manager and access the available extensions, select the extensions icon, or select Extensions in the View menu.
Enter SQL Server Profiler.
Select the extension and Install it.

Start Profiler
- To start Profiler, first make a connection to a server in the Servers tab.
- After you make a connection, type Alt + P to launch Profiler, or right-click on the server connection and select Launch Profiler.
- Select a session template from the dropdown list. For Azure SQL DB, Standard_Azure is the only template available.
- Edit the session name if appropriate, and select Start.
- The session will be started automatically and you will start to see events in the viewer.
- To stop Profiler, type Alt + S or use the Stop button in the toolbar.
- The hotkey Alt + S is a toggle. To restart Profiler, type Alt + S or use the Start button in the toolbar.

Open a saved XEL file
- To view a XEL file that you have saved locally, open the Command Palette using Ctrl/CMD + Shift + P and then type Profiler: Open XEL File and select the command.
- Browse to the saved XEL file and select Open.
- The file will open in the viewer.
Next step
Feedback
Coming soon: Throughout 2024 we will be phasing out GitHub Issues as the feedback mechanism for content and replacing it with a new feedback system. For more information see: https://aka.ms/ContentUserFeedback.
Submit and view feedback for