Monitor Big Data Clusters status by using Azure Data Studio
This article explains how to view the status of a big data cluster using Azure Data Studio.
Important
The Microsoft SQL Server 2019 Big Data Clusters add-on will be retired. Support for SQL Server 2019 Big Data Clusters will end on February 28, 2025. All existing users of SQL Server 2019 with Software Assurance will be fully supported on the platform and the software will continue to be maintained through SQL Server cumulative updates until that time. For more information, see the announcement blog post and Big data options on the Microsoft SQL Server platform.
Use Azure Data Studio
After downloading the latest insiders build of Azure Data Studio, you can view service endpoints and the status of a big data cluster with the SQL Server big data cluster dashboard. Some of the features below are only first available in the insiders build of Azure Data Studio.
First, create a connection to your big data cluster in Azure Data Studio. For more information, see Connect to a SQL Server big data cluster with Azure Data Studio.
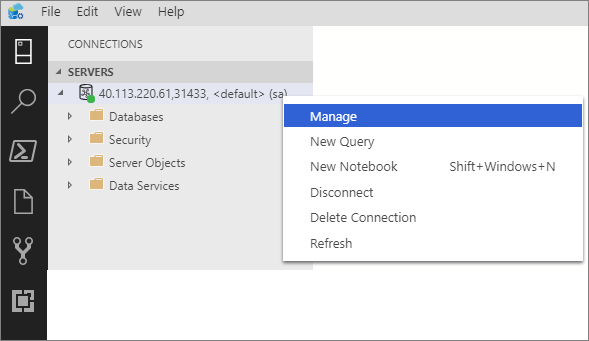
Right-click on the big data cluster endpoint, and select Manage.
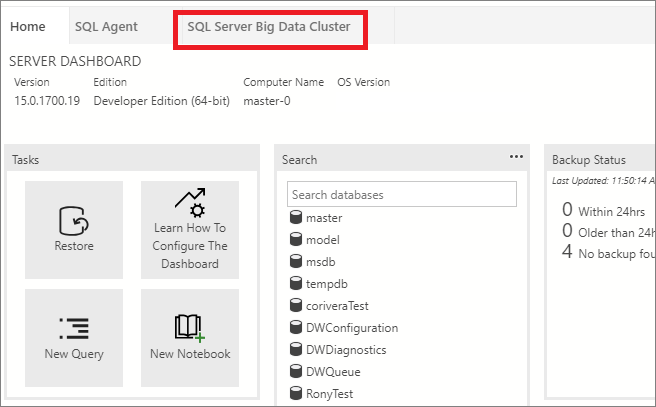
Select the SQL Server Big Data Cluster tab to access the big data cluster dashboard.
Service endpoints
It is important to be able to easily access the various services within a big data cluster. The big data cluster dashboard provides a service endpoints table that allows you to see and copy the service endpoints.
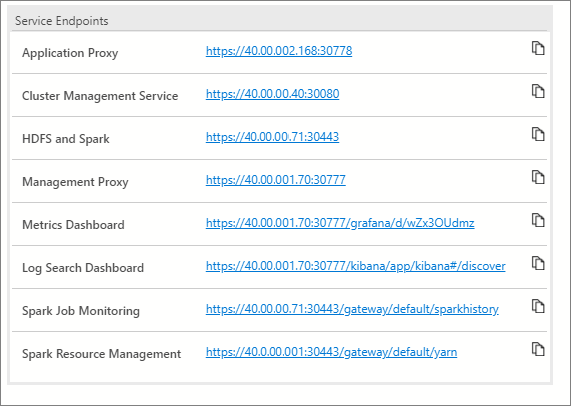
These services list the endpoints that can be copied and pasted when you need the endpoint for connecting to those services. For example, you can select the copy icon to the right of the endpoint and then paste it in a text window requesting that endpoint. The Cluster Management Service endpoint is necessary to run the cluster status notebook.
Dashboards
The service endpoints table also exposes several dashboards for monitoring:
- Metrics (Grafana)
- Logs (Kibana)
- Spark Job Monitoring
- Spark Resource Management
You can directly select on these links. You will be required to authenticate when accessing these dashboards. For the metrics and logs dashboards, provide controller admin credentials that you set at deployment time using environment variables AZDATA_USERNAME and AZDATA_PASSWORD. Spark dashboards will use gateway (Knox) credentials: either AD identity in a cluster integrated with AD or AZDATA_USERNAME and AZDATA_PASSWORD if using basic authentication in your cluster.
Beginning with SQL Server 2019 (15.x) CU 5, when you deploy a new cluster with basic authentication all endpoints including gateway use AZDATA_USERNAME and AZDATA_PASSWORD. Endpoints on clusters that are upgraded to CU 5 continue to use root as username to connect to gateway endpoint. This change does not apply to deployments using Active Directory authentication. See Credentials for accessing services through gateway endpoint in the release notes.
Cluster Status notebook
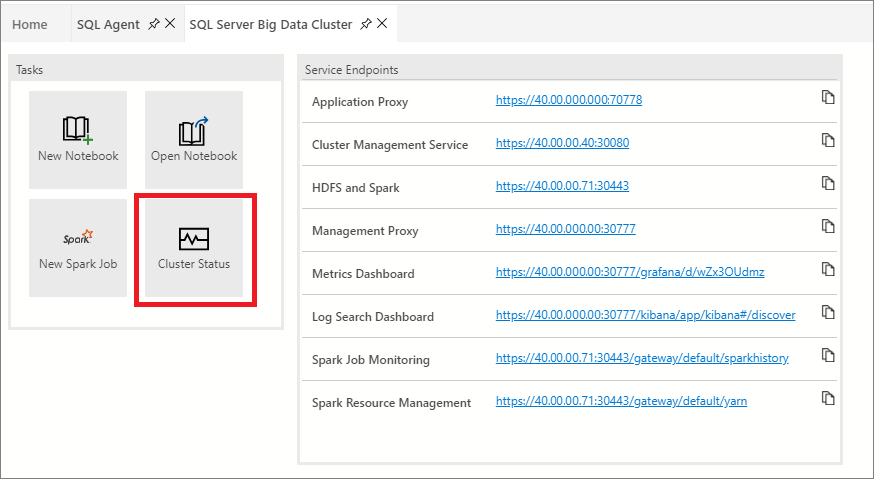
You can also view cluster status of the big data cluster by launching the Cluster Status notebook. To launch the notebook, select the Cluster Status task.
Before you begin, you will need the following items:
- Big data cluster name
- Controller username
- Controller password
- Controller endpoints
The default big data cluster name is mssql-cluster unless you customized it during your deployment. You can find the controller endpoint from the big data cluster dashboard in the Service Endpoints table. The endpoint is listed as Cluster Management Service. If you do not know the credentials, ask the admin who deployed your cluster.
Select Run Cells on the top toolbar.
Follow the prompt for your credentials. Press press ENTER after you type each credential for the big data cluster name, controller username, and controller password.
Note
If you do not have a config file setup with your big data, you will be asked for the controller endpoint. Type or paste it, and then press ENTER to proceed.
If you connected successfully, the rest of the notebook will show the output of each component of the big data cluster. When you want to rerun a certain code cell, hover over the code cell and select the Run icon.
Related content
Feedback
Coming soon: Throughout 2024 we will be phasing out GitHub Issues as the feedback mechanism for content and replacing it with a new feedback system. For more information see: https://aka.ms/ContentUserFeedback.
Submit and view feedback for