Note
Access to this page requires authorization. You can try signing in or changing directories.
Access to this page requires authorization. You can try changing directories.
Applies to: ![]() .NET Framework
.NET Framework ![]() .NET
.NET ![]() .NET Standard
.NET Standard

Event Tracing for Windows (ETW) is an efficient, kernel-level, tracing facility that lets you log driver-defined events for debugging and testing purposes. SqlClient supports capturing ETW events at different informational levels. To begin capturing event traces, client applications should listen for events from SqlClient's EventSource implementation:
Microsoft.Data.SqlClient.EventSource
The current implementation supports the following Event Keywords:
| Keyword name | Value | Description |
|---|---|---|
| ExecutionTrace | 1 | Turns on capturing Start/Stop events before and after command execution. |
| Trace | 2 | Turns on capturing basic application flow trace events. |
| Scope | 4 | Turns on capturing enter and exit events |
| NotificationTrace | 8 | Turns on capturing SqlNotification trace events |
| NotificationScope | 16 | Turns on capturing SqlNotification scope enter and exit events |
| PoolerTrace | 32 | Turns on capturing connection pooling flow trace events. |
| PoolerScope | 64 | Turns on capturing connection pooling scope trace events. |
| AdvancedTrace | 128 | Turns on capturing advanced flow trace events. |
| AdvancedTraceBin | 256 | Turns on capturing advanced flow trace events with additional information. |
| CorrelationTrace | 512 | Turns on capturing correlation flow trace events. |
| StateDump | 1024 | Turns on capturing full state dump of SqlConnection |
| SNITrace | 2048 | Turns on capturing flow trace events from Managed Networking implementation (only applicable in .NET Core) |
| SNIScope | 4096 | Turns on capturing scope events from Managed Networking implementation (only applicable in .NET Core) |
Example
The following example enables event tracing for a data operation on the AdventureWorks sample database and displays the events in the console window.
using System;
using System.Diagnostics.Tracing;
using Microsoft.Data.SqlClient;

// This listener class will listen for events from the SqlClientEventSource class.
// SqlClientEventSource is an implementation of the EventSource class which gives
// it the ability to create events.
public class SqlClientListener : EventListener
{
    protected override void OnEventSourceCreated(EventSource eventSource)
    {
        // Only enable events from SqlClientEventSource.
        if (eventSource.Name.Equals("Microsoft.Data.SqlClient.EventSource"))
        {
            // Use EventKeyWord 2 to capture basic application flow events.
            // See the above table for all available keywords.
            EnableEvents(eventSource, EventLevel.Informational, (EventKeywords)2);
        }
    }

    // This callback runs whenever an event is written by SqlClientEventSource.
    // Event data is accessed through the EventWrittenEventArgs parameter.
    protected override void OnEventWritten(EventWrittenEventArgs eventData)
    {
        // Print event data.
        Console.WriteLine(eventData.Payload[0]);
    }
}

class Program
{
    public static void Main()
    {
        // Create a new event listener.
        using (SqlClientListener listener = new SqlClientListener())
        {
            string connectionString = "Data Source=localhost; " +
                "Initial Catalog=AdventureWorks; Integrated Security=true";

            // Open a connection to the AdventureWorks database.
            using (SqlConnection connection = new SqlConnection(connectionString))
            {
                connection.Open();

                string sql = "SELECT * FROM Sales.Currency";
                SqlCommand command = new SqlCommand(sql, connection);

                // Perform a data operation on the server.
                SqlDataReader reader = command.ExecuteReader();
                while (reader.Read())
                {
                    // Read the data.
                }
                reader.Close();
            }
        }
    }
}
Event tracing support in Native SNI
Microsoft.Data.SqlClient provides event tracing support in Microsoft.Data.SqlClient.SNI and Microsoft.Data.SqlClient.SNI.runtime starting with v2.1. Events can be collected from the native DLLs using the Xperf and PerfView tools.
Starting with Microsoft.Data.SqlClient v3.0, event tracing can be enabled without any modifications in the client application using event collection tools.
With Microsoft.Data.SqlClient v2.1, event tracing needs to be enabled by configuring the EventCommand with an event source listener. The valid EventCommand values applicable to Native SNI are:
// Enables trace events:
EventSource.SendCommand(eventSource, (EventCommand)8192, null);

// Enables flow events:
EventSource.SendCommand(eventSource, (EventCommand)16384, null);

// Enables both trace and flow events:
EventSource.SendCommand(eventSource, (EventCommand)(8192 | 16384), null);
The following example enables event tracing in native SNI DLLs.
// Native SNI tracing example
using System;
using System.Diagnostics.Tracing;
using Microsoft.Data.SqlClient;

public class SqlClientListener : EventListener
{
    protected override void OnEventSourceCreated(EventSource eventSource)
    {
        if (eventSource.Name.Equals("Microsoft.Data.SqlClient.EventSource"))
        {
            // Enables both trace and flow events
            EventSource.SendCommand(eventSource, (EventCommand)(8192 | 16384), null);
        }
    }
}

class Program
{
    static string connectionString = @"Data Source = localhost; Initial Catalog = AdventureWorks;Integrated Security=true;";

    static void Main(string[] args)
    {
        // Event source listener configuration is not required in v3.0 onwards.
        using (SqlClientListener listener = new SqlClientListener())
        using (SqlConnection connection = new SqlConnection(connectionString))
        {
            connection.Open();
        }
    }
}
Use Xperf to collect traces
Start tracing using the following command.
xperf -start trace -f myTrace.etl -on *Microsoft.Data.SqlClient.EventSourceRun the native SNI tracing example to connect to SQL Server.
Stop tracing using the following command line.
xperf -stop traceUse PerfView to open the myTrace.etl file specified in Step 1. The SNI tracing log can be found with
Microsoft.Data.SqlClient.EventSource/SNIScopeandMicrosoft.Data.SqlClient.EventSource/SNITraceevent names.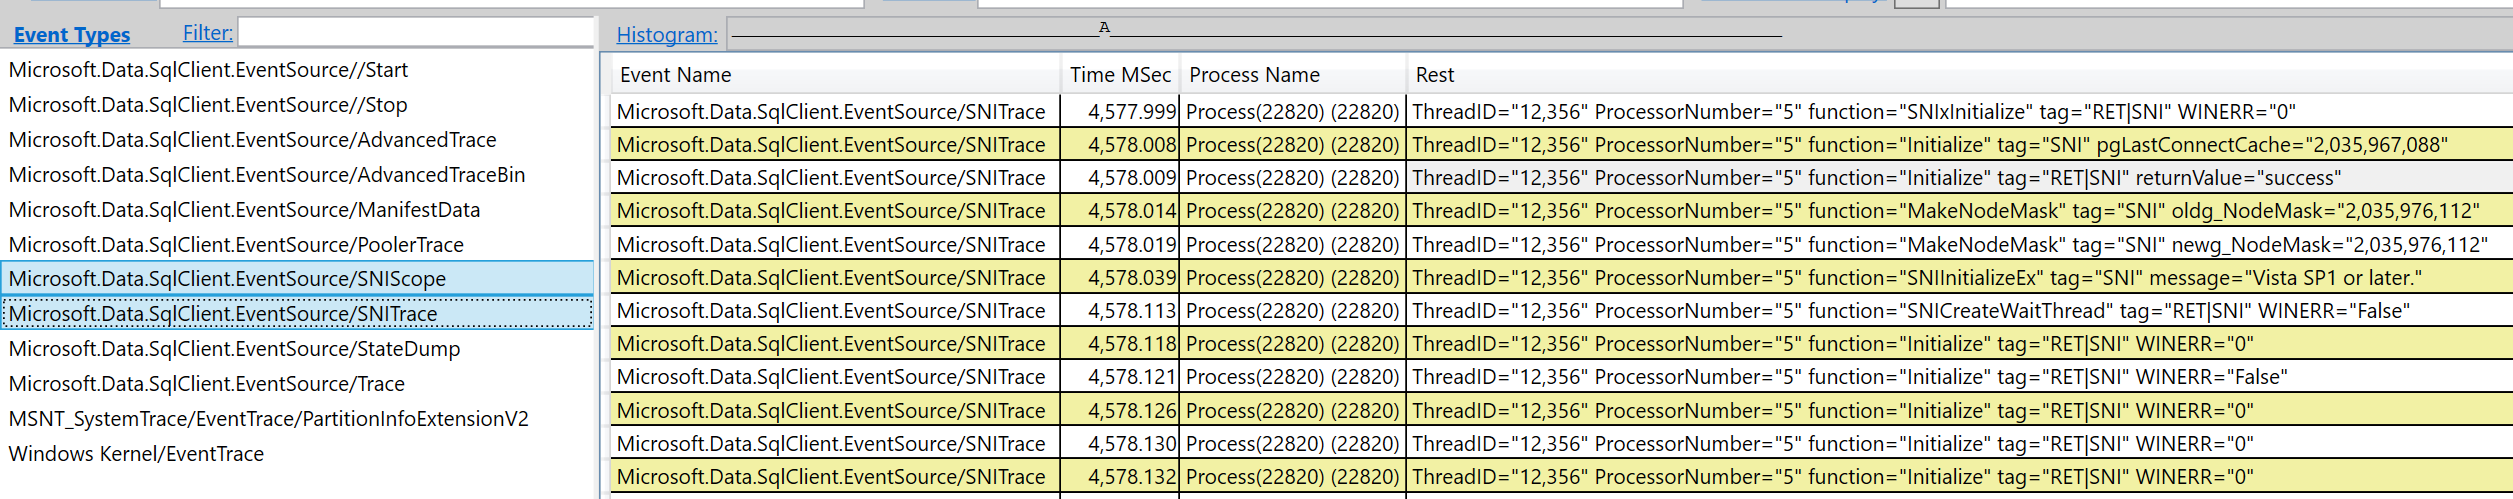
Use PerfView to collect traces
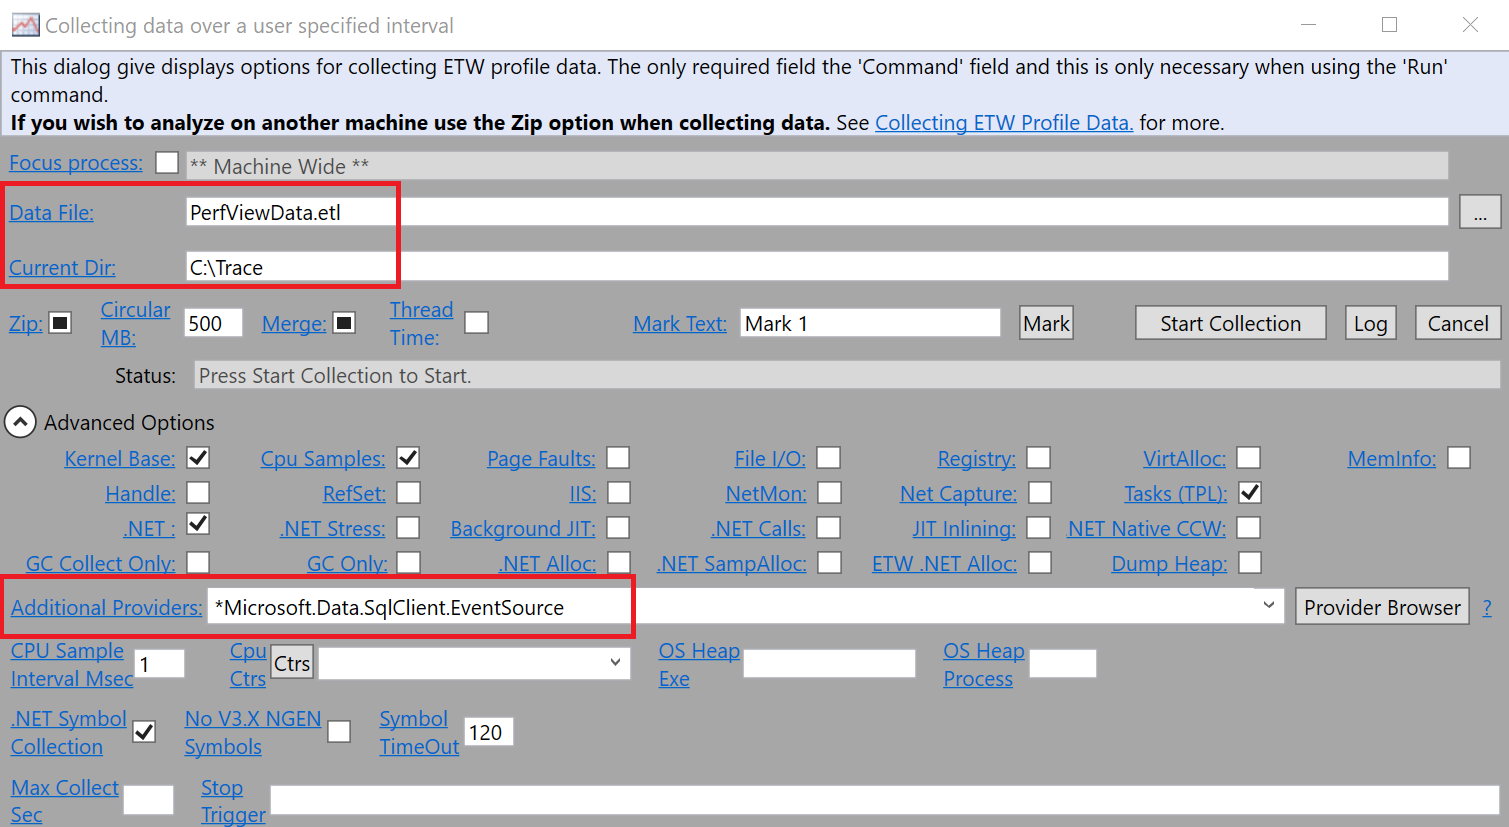
Start PerfView and run
Collect > Collectfrom the menu bar.Configure the trace file name, output path, and provider name.
Start collection.
Run the native SNI tracing example to connect to SQL Server.
Stop collection from PerfView. It takes a while to generate the PerfViewData.etl file according to the configuration in Step 2.
Open the
etlfile in PerfView. The SNI tracing log can be found withMicrosoft.Data.SqlClient.EventSource/SNIScopeandMicrosoft.Data.SqlClient.EventSource/SNITraceevent names.
Use dotnet-trace to collect traces
On Linux, macOS, or Windows, dotnet-trace can be used to capture traces. The dotnet-trace tool is used to collect traces for .NET applications. For more information about dotnet-trace, see the dotnet-trace performance analysis utility The traces created by dotnet-trace can be viewed in PerfView.
If not already installed, install the .NET SDK on the client machine.
Run dotnet-trace. The
--providersparameter requires the provider name and keywords to be specified for traces from Microsoft.Data.SqlClient. The keywords option is a sum of the keyword values in the event keywords table converted to hexadecimal. To collect all events at the verbose level ofMyApplicationfrom the start of the application, the sum of keywords is 8191 and1FFFin hexadecimal. The verbose level is specified in this command by5.dotnet-trace collect --providers Microsoft.Data.SqlClient.EventSource:1FFF:5 -- dotnet MyApplication.dllThe output is:
Provider Name                           Keywords            Level               Enabled By
Microsoft.Data.SqlClient.EventSource    0x0000000000001FFF  Verbose(5)          --providers

Launching: dotnet MyApplication.dll
Process        : /usr/lib/dotnet/dotnet
Output File    : /home/appuser/dotnet_20240927_102506.nettrace

[00:00:00:00]   Recording trace 0.00     (B)
Press <Enter> or <Ctrl+C> to exit...

Trace completed.
Process exited with code '1'.
To collect all events at the information level on a running application, first find the process ID of the application. Then run dotnet-trace on the process. The information level is specified by
4.dotnet-trace ps 8734 MyApplication /home/appuser/MyApplication/MyApplication dotnet-trace collect -–process-id 8734 --providers Microsoft.Data.SqlClient.EventSource:1FFF:4Run the application separately and let it run as long as needed to reproduce the issue. If it's a high CPU issue, 5-10 seconds is usually enough.
Provider Name                           Keywords            Level               Enabled By
Microsoft.Data.SqlClient.EventSource    0x0000000000001FFF  LogAlways(0)        --providers

Process        : /usr/lib/dotnet/dotnet
Output File    : /home/appuser/dotnet_20240927_104154.nettrace

[00:00:00:10]   Recording trace 4.096    (KB)
Press <Enter> or <Ctrl+C> to exit...
Stopping the trace. This may take several minutes depending on the application being traced.

Trace completed.
The trace file name ends in
.nettrace. If not tracing on Windows, copy the file to a Windows system. View the trace file in PerfView.
External resources
For another set of examples on how to trace Microsoft.Data.SqlClient cross-platform, see the CSS SQL Networking Tools wiki.
For more information about event tracing, see the following resources.
| Resource | Description |
|---|---|
| EventSource Class | Used to create ETW events. |
| EventListener Class | Provides methods for enabling and disabling events from event sources. |