Note
Access to this page requires authorization. You can try signing in or changing directories.
Access to this page requires authorization. You can try changing directories.
Applies to: ![]() SQL Server
SQL Server ![]() Azure SQL Database
Azure SQL Database ![]() Azure SQL Managed Instance
Azure SQL Managed Instance
This article describes how you can use SQL Server Management Studio (SSMS) to view target data from Extended Events. The article explains how to:
- Open and view the target data, in various ways.
- Export the target data to various formats, by using the special menu or toolbar for Extended Events.
- Manipulate the data while viewing, or before exporting. You can view, export, filter, and aggregate event data.
Prerequisites
The present article assumes you already know how to create and start an event session. Instructions on how to create an event session are demonstrated early in the following article:
We recommend using a recent release of SSMS. Download it from Download SQL Server Management Studio (SSMS).
Differences with Azure SQL Database
There are certain differences between Extended Events in SQL Server and in Azure SQL Database.
- For Azure SQL Database, the
event_filetarget can't be a file on the local disk drive. Instead, an Azure Storage container must be used. When you're connected to database in Azure SQL Database, the SSMS UI asks for a storage container, instead of a local path and file name. - In the SSMS UI, Watch live data is disabled. This is because that feature isn't available for Azure SQL Database.
- A few Extended Events sessions are installed with SQL Server, for example the
system_healthsession. These sessions aren't available for Azure SQL Database.
The present article is written from the perspective of SQL Server. The article uses the event_file target, which is implemented differently in Extended Events for SQL Server and for Azure SQL Database.
For documentation about Extended Events that is specific to Azure SQL Database, see Extended Events in Azure SQL Database.
Open the SSMS event viewer UI
The SSMS event viewer UI can be accessed in one of the following ways:
- Main menu File > Open > File, then browse for an
xelfile - Right-click on Extended Events in Object Explorer > Management
- The Extended Events menu, and the Extended Events toolbar
- Right-clicks in the tabbed pane that displays the target data
View event_file data in SSMS
There are various ways to view the event_file target data in the SSMS UI. When you specify an event_file target, you set its file path and name, including the xel extension.
- Each time the event session is started, Extended Events adds a numeric suffix to the file name, to make the file name unique.
- Example: Checkpoint_Begins_ES_0_131103935140400000.xel
xelfiles are binary files. They shouldn't be opened in a text editor such as Notepad.- Use the File > Open > Merge Extended Event Files dialog to open multiple event files in the SSMS event viewer UI.
SSMS can display data for most Extended Events targets. But the displays are different for the various targets. For example:
- event_file: Data from an event_file target is displayed in the event viewer, with filtering, aggregation, and other features available.
- ring_buffer: Data from a ring-buffer target is displayed as XML.
SSMS can't display data from the etw_classic_sync_target target.
Open an xel file using File > Open > File
You can open a single xel file from the SSMS main menu, using File > Open > File. You can also drag-and-drop an xel file into SSMS.
View target data
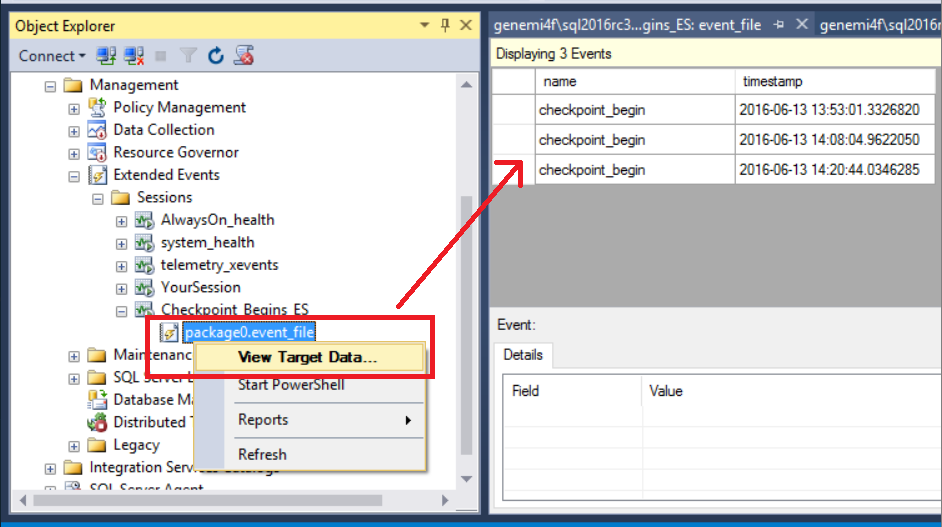
The View Target Data option displays the data that has thus far been captured. In Object Explorer, you can expand the nodes and then right-click:
- Management > Extended Events > Sessions > [your-session] > [your-target-node] > View Target Data.
The target data is displayed in a tabbed pane in SSMS as follows:
Note
View Target Data displays data from all xel files associated with the sessions. Each Start-Stop cycle creates a file with a later time-derived numeric value added to the file name, but each file shares the same root name. Additional rollover xel files are also created when file size exceed the maximum file size specified with the MAX_FILE_SIZE parameter.
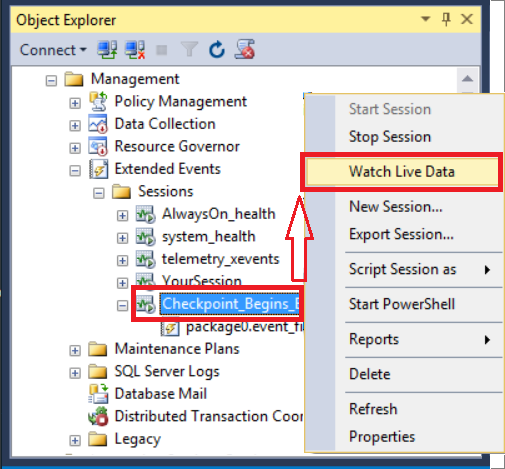
Watch live data
When your event session is running, you might want to watch the event data in real time, as it is received by the target.
- Management > Extended Events > Sessions > [your-session] > Watch Live Data.
The data display is updated at an interval you can specify. See Maximum dispatch latency at:
- Extended Events > Sessions > [your-session] > Properties > Advanced > Maximum dispatch latency
View event data with the sys.fn_xe_file_target_read_file() function
The sys.fn_xe_file_target_read_file() function returns a rowset with each row representing a captured event. Event data is returned as XML. XQuery can be used to present event data relationally.
Export target data
Once you have event data displayed in the SSMS event viewer, you can export it to various formats by doing the following:
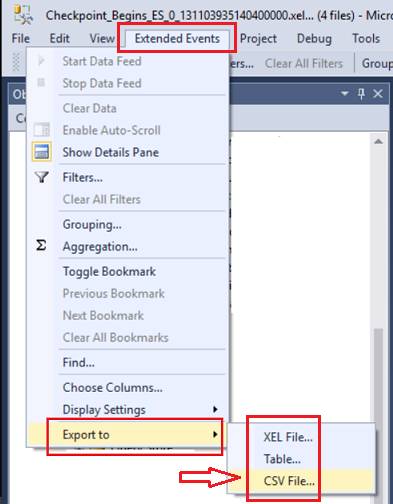
- Select Extended Events on the main menu.
- Select Export to, and then choose a format.
Manipulate data in the display
The SSMS UI offers you several ways to manipulate the data, beyond merely viewing the data as is.
Context menus in the data display
Different places in the data display offer different context menus when you right-click.
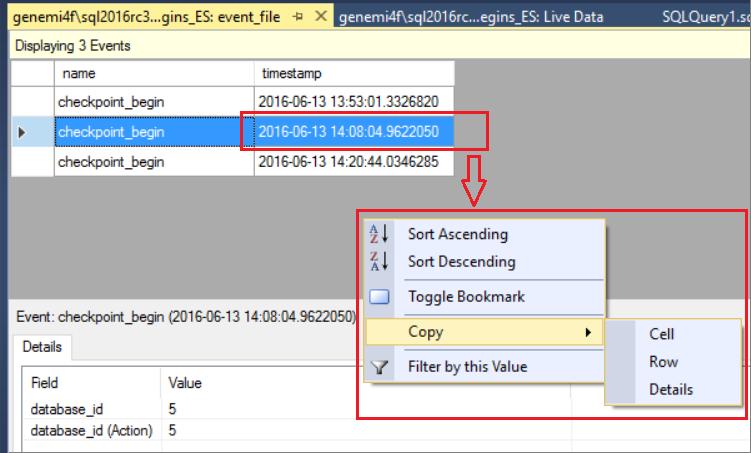
Right-click a data cell
The following screenshot shows the content menu you get when you right-click cell in the data display. The screenshot also shows the expansion of the Copy menu item.
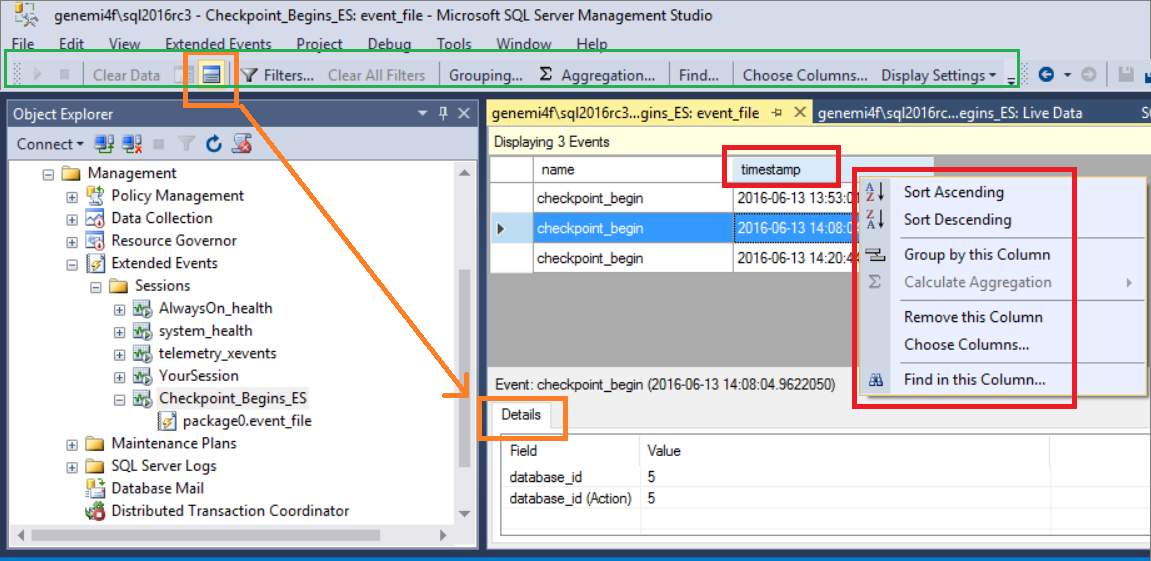
Right-click a column header
The following screenshot shows the context menu from a right-click of the timestamp header.
Choose columns, merge columns
The Choose Columns option enables you to control which data columns are displayed. You can find the Choose Columns menu item in a few different places:
- On the Extended Events menu.
- On the Extended Events toolbar.
- On the context menu of a header in the data display.
When you select Choose Columns, the dialog of the same name is displayed.
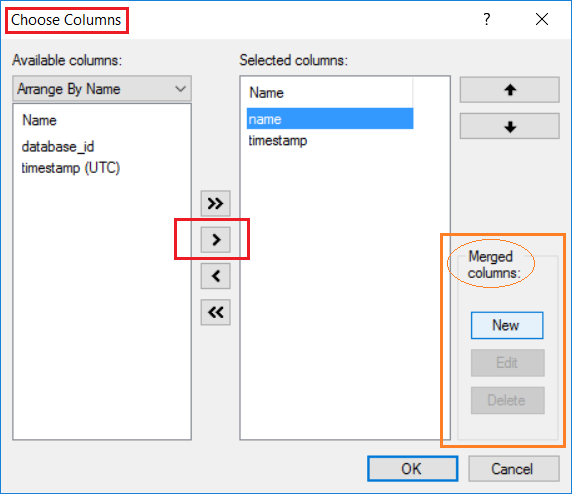
Merge columns
The Choose Columns dialog has a section devoted to the merging of multiple columns into one, for the purposes of display and data export.
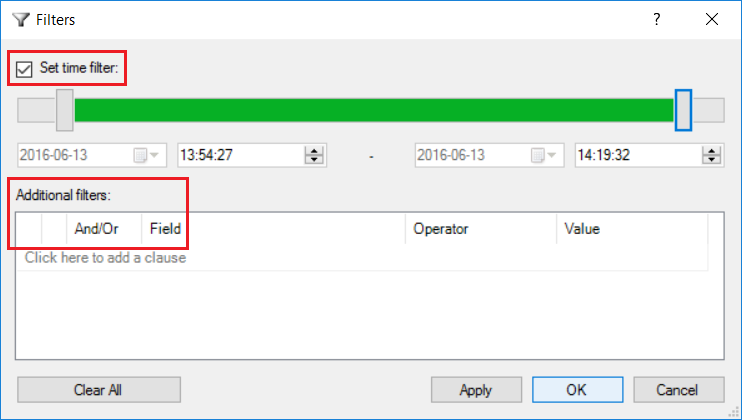
Filters
The filters in the SSMS event viewer can:
- Restrict returned data by the timestamp column
- Filter by a column value
The relationship between the time filter and columns filter is a Boolean AND.
Group and aggregation
Grouping rows together by matching values in a given column, is the first step toward the summary aggregation of data.
Grouping
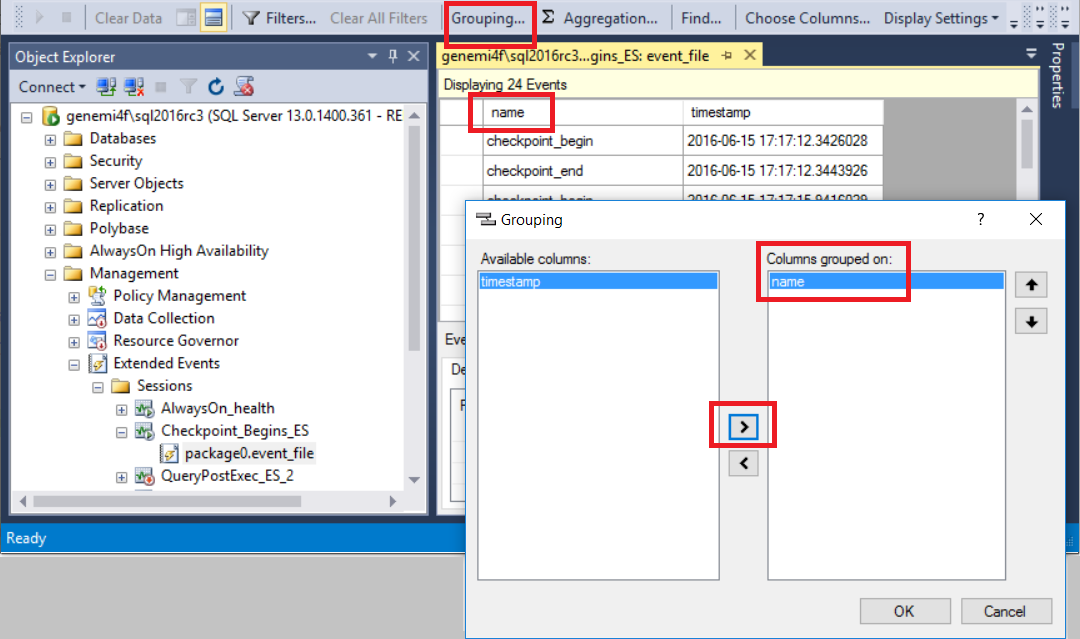
On the Extended Events toolbar, the Grouping button starts a dialog you can use to group the displayed data by a given column. The next screenshot shows a dialog being used to group by the name column.
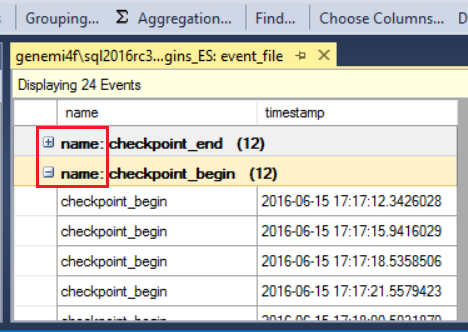
After grouping is completed, the display has a new look, as shown next.
Aggregation
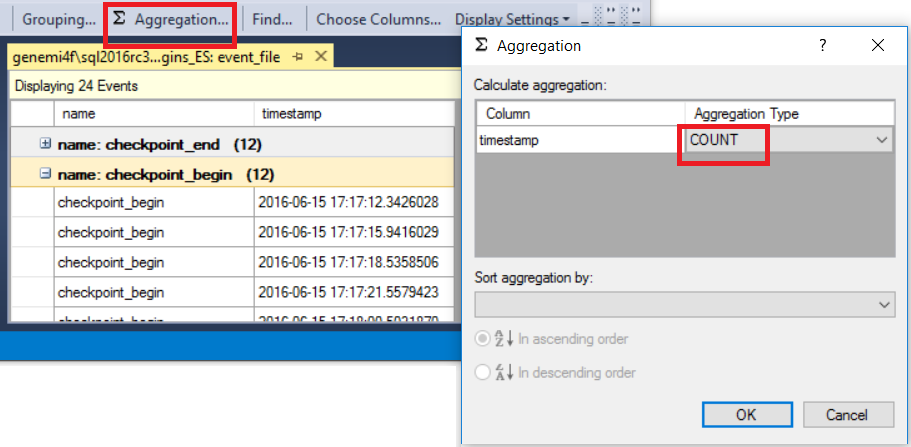
After the displayed data has been grouped, you can proceed to aggregate data in other columns. The next screenshot shows the grouped data is being aggregated by count.
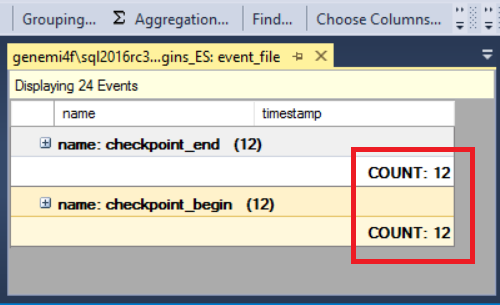
After the aggregation is completed, the display has a new look, as shown next.
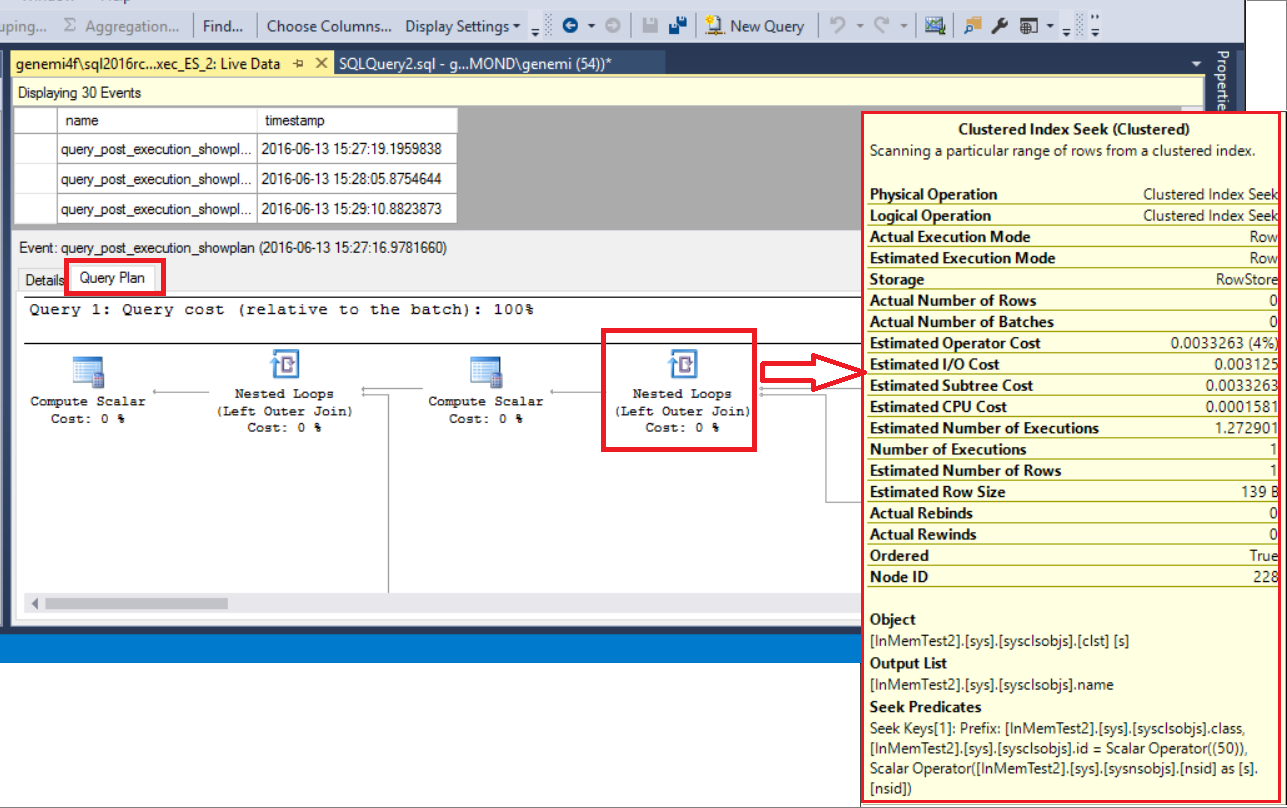
View run time query plan
The query_post_execution_showplan event enables you to see the actual query plan (with runtime statistics included) in the SSMS UI. When the Details pane is visible, you can see the graphical query plan in the Query Plan tab. By hovering over a node on the query plan, you can see a list of property names and their values for the plan node.