Monitor and troubleshoot PolyBase
Applies to: ![]() SQL Server
SQL Server
To troubleshoot PolyBase, use the techniques found in this topic.
Catalog views
Use the catalog views listed here to manage PolyBase operations.
| View | Description |
|---|---|
| sys.external_tables (Transact-SQL) | Identifies external tables. |
| sys.external_data_sources (Transact-SQL) | Identifies external data sources. |
| sys.external_file_formats (Transact-SQL) | Identifies external file formats. |
Dynamic management views
PolyBase queries are broken into a series of steps within sys.dm_exec_distributed_request_steps. The following table provides a mapping from the step name to the associated DMV.
| PolyBase Step | Associated DMV |
|---|---|
HadoopJobOperation |
sys.dm_exec_external_operations |
RandomIdOperation |
sys.dm_exec_distributed_request_steps |
HadoopRoundRobinOperation |
sys.dm_exec_dms_workers |
StreamingReturnOperation |
sys.dm_exec_dms_workers |
OnOperation |
sys.dm_exec_distributed_sql_requests |
Monitor PolyBase queries using DMVs
Monitor and troubleshoot PolyBase queries using the following DMVs. Consider also the following performance considerations in PolyBase for SQL Server.
Find the longest running queries
Record the execution ID of the longest running query.
 -- Find the longest running query
SELECT execution_id, st.text, dr.total_elapsed_time
FROM sys.dm_exec_distributed_requests  dr
      cross apply sys.dm_exec_sql_text(sql_handle) st
ORDER BY total_elapsed_time DESC;
Find the longest running step of the distributed query
Use the execution ID recorded in the previous step. Record the step index of the longest running step.
Check the
location_typeof longest running step:Head or Compute: implies a SQL operation. Proceed with Step 3a.
- DMS: implies a PolyBase Data Movement Service operation. Proceed with Step 3b.
-- Find the longest running step of the distributed query plan
SELECT execution_id, step_index, operation_type, distribution_type,
location_type, status, total_elapsed_time, command
FROM sys.dm_exec_distributed_request_steps
WHERE execution_id = 'QID4547'
ORDER BY total_elapsed_time DESC;
Find the execution progress of the longest running step
Find the execution progress of a SQL step
Use the execution ID and step index recorded in the previous steps.
-- Find the execution progress of SQL step
SELECT execution_id, step_index, distribution_id, status,
total_elapsed_time, row_count, command
FROM sys.dm_exec_distributed_sql_requests
WHERE execution_id = 'QID4547' and step_index = 1;
Find the execution progress of a DMS step
Use the execution ID and step index recorded in the previous steps.
-- Find the execution progress of DMS step
SELECT execution_id, step_index, dms_step_index, status,
type, bytes_processed, total_elapsed_time
FROM sys.dm_exec_dms_workers
WHERE execution_id = 'QID4547'
ORDER BY total_elapsed_time DESC;
Find the information about external DMS operations
Use the execution ID and step index recorded in the previous steps.
SELECT execution_id, step_index, dms_step_index, compute_node_id,
type, input_name, length, total_elapsed_time, status
FROM sys.dm_exec_external_work
WHERE execution_id = 'QID4547' and step_index = 7
ORDER BY total_elapsed_time DESC;
View the PolyBase query plan
In SQL Server 2019 (15.x), you can view the execution plan passed to the external data source using Trace Flag 6408. For more information, see How to tell if external pushdown occurred.
In SQL Server 2016 (13.x) or SQL Server 2017 (14.x), this alternative strategy works:
In SQL Server Management Studio, enable Include Actual Execution Plan (Ctrl + M) and run the query.
Select the Execution plan tab.
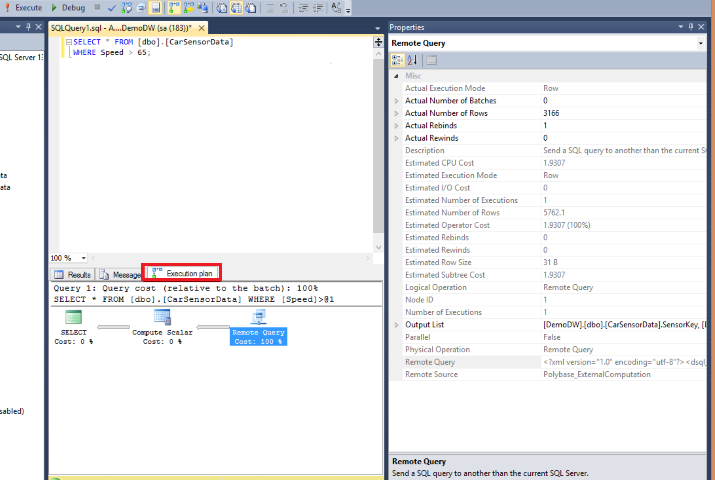
Right-click on the Remote Query operator and select Properties.
Copy and paste the Remote Query value into a text editor to view the XML remote query plan. An example is shown below.
The sql_operation tags indicate operations within SQL Server. The dsql_operations with operation_types that aren't "ON" indicate the external operators used by PolyBase Data Movement service.
<dsql_query number_nodes="1" number_distributions="8" number_distributions_per_node="8">
   <sql>ExecuteMemo explain query</sql>
   <dsql_operations total_cost="0" total_number_operations="6">
     <dsql_operation operation_type="RND_ID">
       <identifier>TEMP_ID_74</identifier>
     </dsql_operation>
     <dsql_operation operation_type="ON">
       <location permanent="false" distribution="AllDistributions" />
       <sql_operations>
         <sql_operation type="statement">CREATE TABLE [tempdb].[dbo].[TEMP_ID_74] ([SensorKey] INT NOT NULL, [CustomerKey] INT NOT NULL, [GeographyKey] INT, [Speed] FLOAT(53) NOT NULL, [YearMeasured] INT NOT NULL ) WITH(DATA_COMPRESSION=PAGE);</sql_operation>
       </sql_operations>
     </dsql_operation>
     <dsql_operation operation_type="ON">
       <location permanent="false" distribution="AllDistributions" />
       <sql_operations>
         <sql_operation type="statement">EXEC [tempdb].[sys].[sp_addextendedproperty] @name=N'IS_EXTERNAL_STREAMING_TABLE', @value=N'true', @level0type=N'SCHEMA', @level0name=N'dbo', @level1type=N'TABLE', @level1name=N'TEMP_ID_74'</sql_operation>
       </sql_operations>
     </dsql_operation>
     <dsql_operation operation_type="ON">
       <location permanent="false" distribution="AllDistributions" />
       <sql_operations>
         <sql_operation type="statement">UPDATE STATISTICS [tempdb].[dbo].[TEMP_ID_74] WITH ROWCOUNT = 2401, PAGECOUNT = 7</sql_operation>
       </sql_operations>
     </dsql_operation>
     <dsql_operation operation_type="MULTI">
       <dsql_operation operation_type="STREAMING_RETURN">
         <operation_cost cost="1" accumulative_cost="1" average_rowsize="24" output_rows="5762.1" />
         <location distribution="AllDistributions" />
         <select>SELECT [T1_1].[SensorKey] AS [SensorKey],
          [T1_1].[CustomerKey] AS [CustomerKey],
          [T1_1].[GeographyKey] AS [GeographyKey],
          [T1_1].[Speed] AS [Speed],
          [T1_1].[YearMeasured] AS [YearMeasured]
   FROM   (SELECT [T2_1].[SensorKey] AS [SensorKey],
                  [T2_1].[CustomerKey] AS [CustomerKey],
                  [T2_1].[GeographyKey] AS [GeographyKey],
                  [T2_1].[Speed] AS [Speed],
                  [T2_1].[YearMeasured] AS [YearMeasured]
           FROM   [tempdb].[dbo].[TEMP_ID_74] AS T2_1
           WHERE  ([T2_1].[Speed] > CAST (6.50000000000000000E+001 AS FLOAT))) AS T1_1</select>
       </dsql_operation>
       <dsql_operation operation_type="ExternalRoundRobinMove">
         <operation_cost cost="16.594848" accumulative_cost="17.594848" average_rowsize="24" output_rows="19207" />
         <external_uri>hdfs://<ip address>:8020/Demo/car_sensordata.tbl/</external_uri>
         <destination_table>[TEMP_ID_74]</destination_table>
       </dsql_operation>
     </dsql_operation>
     <dsql_operation operation_type="ON">
       <location permanent="false" distribution="AllDistributions" />
       <sql_operations>
         <sql_operation type="statement">DROP TABLE [tempdb].[dbo].[TEMP_ID_74]</sql_operation>
       </sql_operations>
     </dsql_operation>
   </dsql_operations>
</dsql_query>
Monitor nodes in a PolyBase group
After configuring a set of machines as part of a PolyBase scale out group, you can monitor the status of the machines. For details on creating a scale out group, see PolyBase scale-out groups.
Connect to SQL Server on the head node of a group.
Run the DMV sys.dm_exec_compute_nodes (Transact-SQL) to view all the nodes in the PolyBase Group.
Run the DMV sys.dm_exec_compute_node_status (Transact-SQL) to view the status of all the nodes in the PolyBase Group.
Hadoop name node high availability
PolyBase does not interface with Name Node HA services like Zookeeper or Knox today. However, there is a proven workaround that can be used to provide the functionality.
Workaround: Use DNS name to reroute connections to the active Name Node. In order to do this, you will need to ensure that the External Data Source is using a DNS name to communicate with the Name Node. When Name Node Failover occurs, you will need to change the IP address associated with the DNS name used in the External Data Source definition. This will reroute all new connections to the correct Name Node. Existing connections will fail when failover occurs. To automate this process, a "heartbeat" can ping the active Name Node. If the heart beat fails, one can assume a failover has occurred and automatically switch to the secondaries IP address.
Log file locations
In Windows servers, the logs are located in the installation directory path, by default: c:\Program Files\Microsoft SQL Server\MSSQLnn.InstanceName\MSSQL\Log\PolyBase\.
In Linux servers, the logs are located by default in /var/opt/mssql/log/polybase.
PolyBase data movement log files:
<INSTANCENAME>_<SERVERNAME>_Dms_errors.log<INSTANCENAME>_<SERVERNAME>_Dms_movement.log
PolyBase engine service log files:
<INSTANCENAME>_<SERVERNAME>_DWEngine_errors.log<INSTANCENAME>_<SERVERNAME>_DWEngine_movement.log<INSTANCENAME>_<SERVERNAME>_DWEngine_server.log
In Windows, PolyBase Java log files:
<SERVERNAME> Dms polybase.log<SERVERNAME>_DWEngine_polybase.log
In Linux, PolyBase Java log files:
/var/opt/mssql-extensibility/hdfs_bridge/log/hdfs_bridge_pdw.log/var/opt/mssql-extensibility/hdfs_bridge/log/hdfs_bridge_dms.log
Error messages and possible solutions
For common troubleshooting scenarios, see PolyBase Errors and Possible Solutions.
Related content
Feedback
Coming soon: Throughout 2024 we will be phasing out GitHub Issues as the feedback mechanism for content and replacing it with a new feedback system. For more information see: https://aka.ms/ContentUserFeedback.
Submit and view feedback for