Note
Access to this page requires authorization. You can try signing in or changing directories.
Access to this page requires authorization. You can try changing directories.
Applies to: ![]() SQL Server
SQL Server ![]() Azure SQL Database
Azure SQL Database ![]() Azure SQL Managed Instance
Azure SQL Managed Instance ![]() Azure Synapse Analytics
Azure Synapse Analytics ![]() Analytics Platform System (PDW)
Analytics Platform System (PDW) ![]() SQL database in Microsoft Fabric
SQL database in Microsoft Fabric
This article discusses deadlocks in the Database Engine in depth. Deadlocks are caused by competing, concurrent locks in the database, often in multi-step transactions. For more information about transactions and locks, see Transaction locking and row versioning guide.
For more specific information on identification and prevention of deadlocks in Azure SQL Database and SQL database in Fabric, see Analyze and prevent deadlocks in Azure SQL Database and SQL database in Fabric.
Understand deadlocks
A deadlock occurs when two or more tasks permanently block each other by each task having a lock on a resource that the other tasks are trying to lock. For example:
Transaction A acquires a shared lock on row 1.
Transaction B acquires a shared lock on row 2.
Transaction A now requests an exclusive lock on row 2, and is blocked until transaction B finishes and releases the shared lock it has on row 2.
Transaction B now requests an exclusive lock on row 1, and is blocked until transaction A finishes and releases the shared lock it has on row 1.
Transaction A can't complete until transaction B completes, but transaction B is blocked by transaction A. This condition is also called a cyclic dependency: Transaction A has a dependency on transaction B, and transaction B closes the circle by having a dependency on transaction A.
Both transactions in a deadlock wait forever, unless the deadlock is broken by an external process. The Database Engine deadlock monitor periodically checks for tasks that are in a deadlock. If the monitor detects a cyclic dependency, it chooses one of the tasks as a victim and terminates its transaction with an error. This allows the other task to complete its transaction. The application with the transaction that terminated with an error can retry the transaction, which usually completes after the other deadlocked transaction finishes.
Deadlocking is often confused with normal blocking. When a transaction requests a lock on a resource locked by another transaction, the requesting transaction waits until the lock is released. By default, transactions in the Database Engine don't time out, unless LOCK_TIMEOUT is set. The requesting transaction is blocked, not deadlocked, because the requesting transaction hasn't done anything to block the transaction owning the lock. Eventually, the owning transaction completes and releases the lock, and then the requesting transaction is granted the lock and proceeds. Deadlocks are resolved almost immediately, whereas blocking can, in theory, persist indefinitely. Deadlocks are sometimes called a deadly embrace.
A deadlock can occur on any system with multiple threads, not just on a relational database management system, and can occur for resources other than locks on database objects. For example, a thread in a multithreaded operating system might acquire one or more resources, such as blocks of memory. If the resource being acquired is currently owned by another thread, the first thread might have to wait for the owning thread to release the target resource. The waiting thread is said to have a dependency on the owning thread for that particular resource. In an instance of the Database Engine, sessions can deadlock when acquiring non-database resources, such as memory or threads.
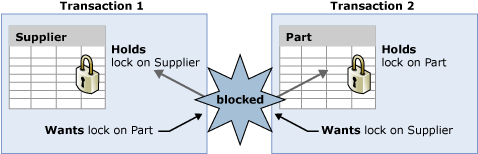
In the illustration, transaction T1 has a dependency on transaction T2 for the Part table lock resource. Similarly, transaction T2 has a dependency on transaction T1 for the Supplier table lock resource. Because these dependencies form a cycle, there's a deadlock between transactions T1 and T2.
Here's a more general illustration of a deadlock:

Task T1 has a lock on resource R1 (indicated by the arrow from R1 to T1), and has requested a lock on resource R2 (indicated by the arrow from T1 to R2).
Task T2 has a lock on resource R2 (indicated by the arrow from R2 to T2), and has requested a lock on resource R1 (indicated by the arrow from T2 to R1).
Because neither task can continue until a resource is available and neither resource can be released until a task continues, a deadlock state exists.
Note
The Database Engine automatically detects deadlock cycles. It chooses one of the transactions as a deadlock victim and terminates it with an error to break the deadlock.
Resources that can deadlock
Each user session might have one or more tasks running on its behalf where each task might acquire or wait to acquire resources. The following types of resources can cause blocking that could result in a deadlock.
Locks. Waiting to acquire locks on resources, such as objects, pages, rows, metadata, and applications can cause a deadlock. For example, transaction T1 has a shared (
S) lock on row r1 and is waiting to get an exclusive (X) lock on r2. Transaction T2 has a shared (S) lock on r2 and is waiting to get an exclusive (X) lock on row r1. This results in a lock cycle in which T1 and T2 wait for each other to release the locked resources.Worker threads. A queued task waiting for an available worker thread can cause a deadlock. If the queued task owns resources that are blocking all worker threads, a deadlock results. For example, session S1 starts a transaction and acquires a shared (
S) lock on row r1 and then goes to sleep. Active sessions running on all available worker threads are trying to acquire exclusive (X) locks on row r1. Because session S1 can't acquire a worker thread, it can't commit the transaction and release the lock on row r1. This results in a deadlock.Memory. When concurrent requests are waiting for memory grants that can't be satisfied with the available memory, a deadlock can occur. For example, two concurrent queries, Q1 and Q2, execute as user-defined functions that acquire 10 MB and 20 MB of memory respectively. If each query needs 30 MB and the total available memory is 20 MB, then Q1 and Q2 must wait for each other to release memory, which results in a deadlock.
Parallel query execution-related resources. Coordinator, producer, or consumer threads associated with an exchange port might block each other causing a deadlock usually when including at least one other process that isn't a part of the parallel query. Also, when a parallel query starts execution, the Database Engine determines the degree of parallelism, and the number of required worker threads, based upon the current workload. If the system workload unexpectedly changes, for example, where new queries start running on the server or the system runs out of worker threads, then a deadlock could occur.
Multiple Active Result Sets (MARS) resources. These resources are used to control interleaving of multiple active requests under MARS. For more information, see Using Multiple Active Result Sets (MARS) in SQL Server Native Client.
User resource. When a thread is waiting for a resource that is potentially controlled by a user application, the resource is considered to be an external or user resource and is treated like a lock.
Session mutex. The tasks running in one session are interleaved, meaning that only one task can run under the session at a given time. Before the task can run, it must have exclusive access to the session mutex.
Transaction mutex. All tasks running in one transaction are interleaved, meaning that only one task can run under the transaction at a given time. Before the task can run, it must have exclusive access to the transaction mutex.
In order for a task to run under MARS, it must acquire the session mutex. If the task is running under a transaction, it must then acquire the transaction mutex. This guarantees that only one task is active at one time in a given session and a given transaction. Once the required mutexes have been acquired, the task can execute. When the task finishes, or yields in the middle of the request, it first releases the transaction mutex, followed by the session mutex, in reverse order of acquisition. However, deadlocks can occur with these resources. In the following pseudocode, two tasks, user request U1 and user request U2, are running in the same session.
U1:    Rs1=Command1.Execute("insert sometable EXEC usp_someproc");
U2:    Rs2=Command2.Execute("select colA from sometable");
The stored procedure executing from user request U1 has acquired the session mutex. If the stored procedure takes a long time to execute, it's assumed by the Database Engine that the stored procedure is waiting for input from the user. User request U2 is waiting for the session mutex while the user is waiting for the result set from U2, and U1 is waiting for a user resource. This is deadlock state logically illustrated as:

Deadlocks can also occur when a table is partitioned and the LOCK_ESCALATION setting of ALTER TABLE is set to AUTO. When LOCK_ESCALATION is set to AUTO, concurrency increases by allowing the Database Engine to lock table partitions at the HoBT level instead of at the table level. However, when separate transactions hold partition locks in a table and want a lock somewhere on the other transactions partition, this causes a deadlock. This type of deadlock can be avoided by setting LOCK_ESCALATION to TABLE. However, this setting reduces concurrency by forcing large updates to a partition to wait for a table lock.
Deadlock detection
All of the resources listed in the Resources that can deadlock section participate in the Database Engine deadlock detection scheme. Deadlock detection is performed by a lock monitor thread that periodically initiates a search through all of the tasks in an instance of the Database Engine. The following points describe the search process:
The default interval is 5 seconds.
If the lock monitor thread finds deadlocks, the deadlock detection interval drops from 5 seconds to as low as 100 milliseconds depending on the frequency of deadlocks.
If the lock monitor thread stops finding deadlocks, the Database Engine increases the intervals between searches to 5 seconds.
If a deadlock is detected, it's assumed that the new threads that must wait for a lock are entering the deadlock cycle. The first few lock waits after a deadlock is detected immediately trigger a deadlock search, rather than wait for the next deadlock detection interval. For example, if the current interval is 5 seconds, and a deadlock was just detected, the next lock wait kicks off the deadlock detector immediately. If this lock wait is part of a deadlock, it's detected right away, rather than during the next deadlock search.
The Database Engine typically performs periodic deadlock detection only. Because the number of deadlocks encountered in the system is usually small, periodic deadlock detection helps reduce the overhead of deadlock detection in the system.
When the lock monitor initiates deadlock search for a particular thread, it identifies the resource on which the thread is waiting. The lock monitor then finds the owners for that particular resource and recursively continues the deadlock search for those threads until it finds a cycle. A cycle identified in this manner forms a deadlock.
After a deadlock is detected, the Database Engine ends a deadlock by choosing one of the threads as a deadlock victim. The Database Engine terminates the current batch being executed for the thread, rolls back the transaction of the deadlock victim, and returns error 1205 to the application. Rolling back the transaction for the deadlock victim releases all locks held by the transaction. This allows the transactions of the other threads to become unblocked and continue. The 1205 (deadlock victim) error records information about the type of resources involved in a deadlock.
By default, the Database Engine chooses the transaction running the transaction that is the least expensive to roll back as the deadlock victim. Alternatively, a user can specify the priority of sessions in a deadlock situation using the SET DEADLOCK_PRIORITY statement. DEADLOCK_PRIORITY can be set to LOW, NORMAL, or HIGH, or alternatively can be set to any integer value in the range from -10 to 10. In certain cases, the Database Engine might opt to alter the deadlock priority for a short duration to achieve better concurrency.
The deadlock priority defaults to NORMAL, or 0. If two sessions have different deadlock priorities, the transaction on the session with the lower priority is chosen as the deadlock victim. If both sessions have the same deadlock priority, the transaction that is least expensive to roll back is chosen. If sessions involved in the deadlock cycle have the same deadlock priority and the same cost, a victim is chosen randomly. A task that is rolling back can't be chosen as a deadlock victim.
When working with common language runtime (CLR), the deadlock monitor automatically detects deadlocks for synchronization resources (monitors, reader/writer lock, and thread join) accessed inside managed procedures. However, the deadlock is resolved by throwing an exception in the procedure that was selected to be the deadlock victim. It's important to understand that the exception doesn't automatically release resources currently owned by the victim; the resources must be explicitly released. Consistent with exception behavior, the exception used to identify a deadlock victim can be caught and dismissed.
Deadlock information tools
To view deadlock information, the Database Engine provides monitoring tools in the form of the xml_deadlock_report extended event, two trace flags, and the deadlock graph event in SQL Profiler.
The xml_deadlock_report extended event is the recommended method for capturing deadlock information.
Deadlock extended event
In SQL Server 2012 (11.x) and later versions, the xml_deadlock_report extended event should be used instead of the deadlock graph event class in SQL Trace or SQL Profiler.
The system_health event session captures xml_deadlock_report events by default. These events contain the deadlock graph. Because the system_health session is enabled by default, you don't need to configure a separate event session to capture deadlock information.
The deadlock graph captured typically has three distinct nodes:
victim-list. The deadlock victim process identifier.process-list. Information on all the processes involved in the deadlock.resource-list. Information about the resources involved in the deadlock.
You can view the event_file target data of the system_health session in Management Studio. If any xml_deadlock_report events occurred, Management Studio presents a graphical depiction of the tasks and resources involved in a deadlock, as seen in the following example:

The following query can view all deadlock events captured by the ring_buffer target of the system_health session:
SELECT xdr.value('@timestamp', 'datetime') AS deadlock_time,
       xdr.query('.') AS event_data
FROM (SELECT CAST ([target_data] AS XML) AS target_data
      FROM sys.dm_xe_session_targets AS xt
           INNER JOIN sys.dm_xe_sessions AS xs
               ON xs.address = xt.event_session_address
      WHERE xs.name = N'system_health'
            AND xt.target_name = N'ring_buffer') AS XML_Data
CROSS APPLY Target_Data.nodes('RingBufferTarget/event[@name="xml_deadlock_report"]') AS XEventData(xdr)
ORDER BY deadlock_time DESC;
Here's the result set.
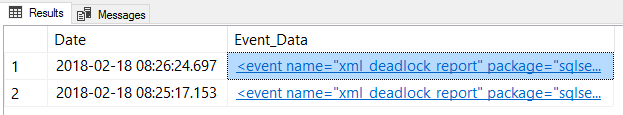
The following example shows an example of the output from the event_data column:
<event name="xml_deadlock_report" package="sqlserver" timestamp="2022-02-18T08:26:24.698Z">
  <data name="xml_report">
    <type name="xml" package="package0" />
    <value>
      <deadlock>
        <victim-list>
          <victimProcess id="process27b9b0b9848" />
        </victim-list>
        <process-list>
          <process id="process27b9b0b9848" taskpriority="0" logused="0" waitresource="KEY: 5:72057594214350848 (1a39e6095155)" waittime="1631" ownerId="11088595" transactionname="SELECT" lasttranstarted="2022-02-18T00:26:23.073" XDES="0x27b9f79fac0" lockMode="S" schedulerid="9" kpid="15336" status="suspended" spid="62" sbid="0" ecid="0" priority="0" trancount="0" lastbatchstarted="2022-02-18T00:26:22.893" lastbatchcompleted="2022-02-18T00:26:22.890" lastattention="1900-01-01T00:00:00.890" clientapp="SQLCMD" hostname="ContosoServer" hostpid="7908" loginname="CONTOSO\user" isolationlevel="read committed (2)" xactid="11088595" currentdb="5" lockTimeout="4294967295" clientoption1="538968096" clientoption2="128056">
            <executionStack>
              <frame procname="AdventureWorks2022.dbo.p1" line="3" stmtstart="78" stmtend="180" sqlhandle="0x0300050020766505ca3e07008ba8000001000000000000000000000000000000000000000000000000000000">
SELECT c2, c3 FROM t1 WHERE c2 BETWEEN @p1 AND @p1+    </frame>
              <frame procname="adhoc" line="4" stmtstart="82" stmtend="98" sqlhandle="0x020000006263ec01ebb919c335024a072a2699958d3fcce60000000000000000000000000000000000000000">
unknown    </frame>
            </executionStack>
            <inputbuf>
SET NOCOUNT ON
WHILE (1=1)
BEGIN
    EXEC p1 4
END
   </inputbuf>
          </process>
          <process id="process27b9ee33c28" taskpriority="0" logused="252" waitresource="KEY: 5:72057594214416384 (e5b3d7e750dd)" waittime="1631" ownerId="11088593" transactionname="UPDATE" lasttranstarted="2022-02-18T00:26:23.073" XDES="0x27ba15a4490" lockMode="X" schedulerid="6" kpid="5584" status="suspended" spid="58" sbid="0" ecid="0" priority="0" trancount="2" lastbatchstarted="2022-02-18T00:26:22.890" lastbatchcompleted="2022-02-18T00:26:22.890" lastattention="1900-01-01T00:00:00.890" clientapp="SQLCMD" hostname="ContosoServer" hostpid="15316" loginname="CONTOSO\user" isolationlevel="read committed (2)" xactid="11088593" currentdb="5" lockTimeout="4294967295" clientoption1="538968096" clientoption2="128056">
            <executionStack>
              <frame procname="AdventureWorks2022.dbo.p2" line="3" stmtstart="76" stmtend="150" sqlhandle="0x03000500599a5906ce3e07008ba8000001000000000000000000000000000000000000000000000000000000">
UPDATE t1 SET c2 = c2+1 WHERE c1 = @p    </frame>
              <frame procname="adhoc" line="4" stmtstart="82" stmtend="98" sqlhandle="0x02000000008fe521e5fb1099410048c5743ff7da04b2047b0000000000000000000000000000000000000000">
unknown    </frame>
            </executionStack>
            <inputbuf>
SET NOCOUNT ON
WHILE (1=1)
BEGIN
    EXEC p2 4
END
   </inputbuf>
          </process>
        </process-list>
        <resource-list>
          <keylock hobtid="72057594214350848" dbid="5" objectname="AdventureWorks2022.dbo.t1" indexname="cidx" id="lock27b9dd26a00" mode="X" associatedObjectId="72057594214350848">
            <owner-list>
              <owner id="process27b9ee33c28" mode="X" />
            </owner-list>
            <waiter-list>
              <waiter id="process27b9b0b9848" mode="S" requestType="wait" />
            </waiter-list>
          </keylock>
          <keylock hobtid="72057594214416384" dbid="5" objectname="AdventureWorks2022.dbo.t1" indexname="idx1" id="lock27afa392600" mode="S" associatedObjectId="72057594214416384">
            <owner-list>
              <owner id="process27b9b0b9848" mode="S" />
            </owner-list>
            <waiter-list>
              <waiter id="process27b9ee33c28" mode="X" requestType="wait" />
            </waiter-list>
          </keylock>
        </resource-list>
      </deadlock>
    </value>
  </data>
</event>
Trace flag 1204 and trace flag 1222
When deadlocks occur and trace flag 1204 or trace flag 1222 is enabled, deadlock details are reported in the SQL Server error log. Trace flag 1204 reports deadlock information formatted by each node involved in the deadlock. Trace flag 1222 formats deadlock information, first by processes and then by resources. It's possible to enable both trace flags to obtain two representations of the same deadlock event.
Important
Avoid using trace flags 1204 and 1222 on workload-intensive systems that are experiencing deadlocks. Using these trace flags might introduce performance issues. Instead, use the Deadlock extended event to capture the necessary information.
In addition to defining the properties of trace flags 1204 and 1222, the following table also shows the similarities and differences.
| Property | Trace flag 1204 and trace flag 1222 | Trace flag 1204 only | Trace flag 1222 only |
|---|---|---|---|
| Output format | Output is captured in the SQL Server error log. | Focused on the nodes involved in the deadlock. Each node has a dedicated section, and the final section describes the deadlock victim. | Returns information in an XML-like format that doesn't conform to an XML Schema Definition (XSD) schema. The format has three major sections. The first section declares the deadlock victim. The second section describes each process involved in the deadlock. The third section describes the resources that are synonymous with nodes in trace flag 1204. |
| Identifying attributes | SPID:<x> ECID:<x>. Identifies the session ID thread in cases of parallel processes. The entry SPID:<x> ECID:0, where <x> is replaced by the SPID value, represents the main thread. The entry SPID:<x> ECID:<y>, where <x> is replaced by the SPID value and <y> is greater than 0, represents the execution context for the same SPID.BatchID (sbid for trace flag 1222). Identifies the batch from which code execution is requesting or holding a lock. When Multiple Active Result Sets (MARS) is disabled, the BatchID value is 0. When MARS is enabled, the value for active batches is 1 to n. If there are no active batches in the session, BatchID is 0.Mode Specifies the type of lock for a particular resource that is requested, granted, or waited on by a thread. Mode can be Intent Shared (IS), Shared (S), Update (U), Intent Exclusive (IX), Shared with Intent Exclusive (SIX), and Exclusive (X).Line # (line for trace flag 1222). Lists the line number in the current batch of statements that was being executed when the deadlock occurred.Input Buf (inputbuf for trace flag 1222). Lists all the statements in the current batch. |
Node Represents the entry number in the deadlock chain.Lists The lock owner can be part of these lists:Grant List Enumerates the current owners of the resource.Convert List Enumerates the current owners that are trying to convert their locks to a higher level.Wait List Enumerates current new lock requests for the resource.Statement Type Describes the type of statement (SELECT, INSERT, UPDATE, or DELETE) on which the threads have permissions.Victim Resource Owner Specifies the participating thread that the Database Engine chooses as the victim to break the deadlock cycle. The chosen thread and all of its execution contexts are terminated.Next Branch Represents the two or more execution contexts from the same SPID that are involved in the deadlock cycle. |
deadlock victim Represents the physical memory address of the task (see sys.dm_os_tasks) that was selected as a deadlock victim. The value might be zero in the case of an unresolved deadlock.executionstack Represents the Transact-SQL call stack that is being executed at the time the deadlock occurs.priority Represents deadlock priority.logused Log space used by the task.owner id The ID of the transaction that has control of the request.status State of the task. For more information, see sys.dm_os_tasks.waitresource The resource needed by the task.waittime Time in milliseconds waiting for the resource.schedulerid The scheduler associated with this task. See sys.dm_os_schedulers.hostname The name of the workstation.isolationlevel The current transaction isolation level.Xactid The ID of the transaction that has control of the request.currentdb The ID of the database.lastbatchstarted The last time a client process started batch execution.lastbatchcompleted The last time a client process completed batch execution.clientoption1 and clientoption2 The set options on this session. These values are bitmasks representing the options usually controlled by SET statements such as SET NOCOUNT and SET XACTABORT. For more information, see @@OPTIONS.associatedObjectId Represents the HoBT (heap or B-tree) ID. |
| Resource attributes | RID identifies the single row within a table on which a lock is held or requested. RID is represented as RID: db_id:file_id:page_no:row_no. For example, RID: 6:1:20789:0.OBJECT identifies the table on which a lock is held or requested. OBJECT is represented as OBJECT: db_id:object_id. For example, TAB: 6:2009058193.KEY Identifies the key range within an index on which a lock is held or requested. KEY is represented as KEY: db_id:hobt_id (index key hash value). For example, KEY: 6:72057594057457664 (350007a4d329).PAG Identifies the page resource on which a lock is held or requested. PAG is represented as PAG: db_id:file_id:page_no. For example, PAG: 6:1:20789.EXT Identifies the extent structure. EXT is represented as EXT: db_id:file_id:extent_no. For example, EXT: 6:1:9.DB Identifies the database lock. DB is represented in one of the following ways:DB: db_idDB: db_id[BULK-OP-DB], which identifies the database lock taken by database backup.DB: db_id[BULK-OP-LOG], which identifies the lock taken by the log backup.APP Identifies an application lock. APP is represented as APP: lock_resource. For example, APP: Formf370f478.METADATA Represents metadata resources involved in a deadlock. Because METADATA has many subresources, the value returned depends upon the subresource that has deadlocked. For example, METADATA.USER_TYPE returns user_type_id = *integer_value*. For more information about METADATA resources and subresources, see sys.dm_tran_locks.HOBT Represents a heap or B-tree involved in a deadlock. |
None exclusive to this trace flag. | None exclusive to this trace flag. |
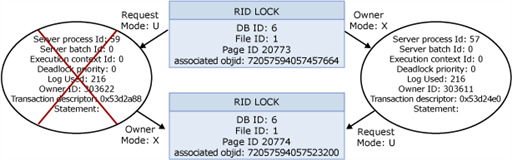
Trace flag 1204 example
The following example shows the output when trace flag 1204 is turned on. In this case, the table in Node 1 is a heap with no indexes, and the table in Node 2 is a heap with a nonclustered index. The index key in Node 2 is being updated when the deadlock occurs.
Deadlock encountered .... Printing deadlock information
Wait-for graph

Node:1

RID: 6:1:20789:0               CleanCnt:3 Mode:X Flags: 0x2
 Grant List 0:
   Owner:0x0315D6A0 Mode: X
     Flg:0x0 Ref:0 Life:02000000 SPID:55 ECID:0 XactLockInfo: 0x04D9E27C
   SPID: 55 ECID: 0 Statement Type: UPDATE Line #: 6
   Input Buf: Language Event:
BEGIN TRANSACTION
   EXEC usp_p2
 Requested By:
   ResType:LockOwner Stype:'OR'Xdes:0x03A3DAD0
     Mode: U SPID:54 BatchID:0 ECID:0 TaskProxy:(0x04976374) Value:0x315d200 Cost:(0/868)

Node:2

KEY: 6:72057594057457664 (350007a4d329) CleanCnt:2 Mode:X Flags: 0x0
 Grant List 0:
   Owner:0x0315D140 Mode: X
     Flg:0x0 Ref:0 Life:02000000 SPID:54 ECID:0 XactLockInfo: 0x03A3DAF4
   SPID: 54 ECID: 0 Statement Type: UPDATE Line #: 6
   Input Buf: Language Event:
     BEGIN TRANSACTION
       EXEC usp_p1
 Requested By:
   ResType:LockOwner Stype:'OR'Xdes:0x04D9E258
     Mode: U SPID:55 BatchID:0 ECID:0 TaskProxy:(0x0475E374) Value:0x315d4a0 Cost:(0/380)

Victim Resource Owner:
 ResType:LockOwner Stype:'OR'Xdes:0x04D9E258
     Mode: U SPID:55 BatchID:0 ECID:0 TaskProxy:(0x0475E374) Value:0x315d4a0 Cost:(0/380)
Trace flag 1222 example
The following example shows the output when trace flag 1222 is turned on. In this case, one table is a heap with no indexes, and the other table is a heap with a nonclustered index. In the second table, the index key is being updated when the deadlock occurs.
deadlock-list
 deadlock victim=process689978
  process-list
   process id=process6891f8 taskpriority=0 logused=868
   waitresource=RID: 6:1:20789:0 waittime=1359 ownerId=310444
   transactionname=user_transaction
   lasttranstarted=2022-02-05T11:22:42.733 XDES=0x3a3dad0
   lockMode=U schedulerid=1 kpid=1952 status=suspended spid=54
   sbid=0 ecid=0 priority=0 transcount=2
   lastbatchstarted=2022-02-05T11:22:42.733
   lastbatchcompleted=2022-02-05T11:22:42.733
   clientapp=Microsoft SQL Server Management Studio - Query
   hostname=TEST_SERVER hostpid=2216 loginname=DOMAIN\user
   isolationlevel=read committed (2) xactid=310444 currentdb=6
   lockTimeout=4294967295 clientoption1=671090784 clientoption2=390200
    executionStack
     frame procname=AdventureWorks2022.dbo.usp_p1 line=6 stmtstart=202
     sqlhandle=0x0300060013e6446b027cbb00c69600000100000000000000
     UPDATE T2 SET COL1 = 3 WHERE COL1 = 1;
     frame procname=adhoc line=3 stmtstart=44
     sqlhandle=0x01000600856aa70f503b8104000000000000000000000000
     EXEC usp_p1
    inputbuf
      BEGIN TRANSACTION
       EXEC usp_p1
   process id=process689978 taskpriority=0 logused=380
   waitresource=KEY: 6:72057594057457664 (350007a4d329)
   waittime=5015 ownerId=310462 transactionname=user_transaction
   lasttranstarted=2022-02-05T11:22:44.077 XDES=0x4d9e258 lockMode=U
   schedulerid=1 kpid=3024 status=suspended spid=55 sbid=0 ecid=0
   priority=0 transcount=2 lastbatchstarted=2022-02-05T11:22:44.077
   lastbatchcompleted=2022-02-05T11:22:44.077
   clientapp=Microsoft SQL Server Management Studio - Query
   hostname=TEST_SERVER hostpid=2216 loginname=DOMAIN\user
   isolationlevel=read committed (2) xactid=310462 currentdb=6
   lockTimeout=4294967295 clientoption1=671090784 clientoption2=390200
    executionStack
     frame procname=AdventureWorks2022.dbo.usp_p2 line=6 stmtstart=200
     sqlhandle=0x030006004c0a396c027cbb00c69600000100000000000000
     UPDATE T1 SET COL1 = 4 WHERE COL1 = 1;
     frame procname=adhoc line=3 stmtstart=44
     sqlhandle=0x01000600d688e709b85f8904000000000000000000000000
     EXEC usp_p2
    inputbuf
      BEGIN TRANSACTION
        EXEC usp_p2
  resource-list
   ridlock fileid=1 pageid=20789 dbid=6 objectname=AdventureWorks2022.dbo.T2
   id=lock3136940 mode=X associatedObjectId=72057594057392128
    owner-list
     owner id=process689978 mode=X
    waiter-list
     waiter id=process6891f8 mode=U requestType=wait
   keylock hobtid=72057594057457664 dbid=6 objectname=AdventureWorks2022.dbo.T1
   indexname=nci_T1_COL1 id=lock3136fc0 mode=X
   associatedObjectId=72057594057457664
    owner-list
     owner id=process6891f8 mode=X
    waiter-list
     waiter id=process689978 mode=U requestType=wait
Profiler deadlock graph event
SQL Profiler has an event that presents a graphical depiction of the tasks and resources involved in a deadlock. The following example shows the output from SQL Profiler when the deadlock graph event is turned on.
The SQL Profiler and SQL Trace features are deprecated and replaced by Extended Events. Extended Events has a smaller performance overhead, and is more configurable than SQL Trace. Consider using the Extended Events deadlock event instead of tracing deadlocks in SQL Profiler.
For more information about the deadlock event, see Lock:Deadlock Event Class. For more information about SQL Profiler deadlock graphs, see Save deadlock graphs (SQL Server Profiler).
Extended Events provides equivalents of SQL Trace event classes. For more information, see View the Extended Events Equivalents to SQL Trace Event Classes. Extended Events is recommended over SQL Trace.
Handle deadlocks
When an instance of the Database Engine chooses a transaction as a deadlock victim, it terminates the current batch, rolls back the transaction, and returns error 1205 to the application. The returned message is structured as follows:
Your transaction (process ID #...) was deadlocked on {lock | communication buffer | thread} resources with another process and has been chosen as the deadlock victim. Rerun your transaction.
Because any application submitting Transact-SQL queries can be chosen as the deadlock victim, applications should have an error handler that can handle error 1205. If an application doesn't handle the error, the application can proceed unaware that its transaction has been rolled back.
Implementing an error handler that catches error 1205 allows an application to handle deadlocks and take remedial action (for example, automatically resubmitting the query that was involved in the deadlock).
The application should pause briefly before resubmitting its query. This gives the other transaction involved in the deadlock a chance to complete and release its locks. Randomizing the duration of the pause minimizes the likelihood of the deadlock reoccurring when the resubmitted query requests its locks. For example, the error handler might be coded to pause for a random duration between one and three seconds.
Handle with TRY...CATCH
You can use TRY...CATCH to handle deadlocks. Error 1205 can be caught by the CATCH block.
For more information, see Handling Deadlocks.
Minimize deadlocks
Although deadlocks can't be completely avoided, following certain coding conventions can minimize the chance of generating a deadlock. Minimizing deadlocks can increase transaction throughput and reduce system overhead because fewer transactions are:
- Rolled back, undoing all the work performed by the transaction.
- Resubmitted by applications because they were rolled back when deadlocked.
To help minimize deadlocks:
- Access objects in the same order.
- Avoid user interaction in transactions.
- Keep transactions short and in one batch.
- Avoid higher isolation levels such as
REPEATABLE READandSERIALIZABLEwhen not required. - Use a row versioning-based isolation level.
- Enable the
READ_COMMITTED_SNAPSHOTdatabase option to use row versioning for transactions using theREAD COMMITTEDisolation level. - Use snapshot isolation transactions.
- Enable the
- Use bound connections.
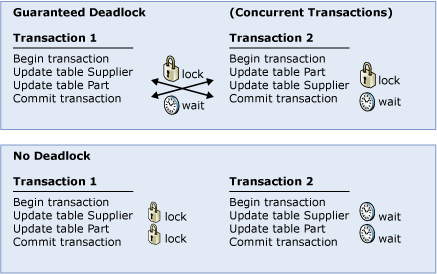
Access objects in the same order
If all concurrent transactions access objects in the same order, deadlocks are less likely to occur. For example, if two concurrent transactions obtain a lock on the Supplier table and then on the Part table, one transaction is blocked on the Supplier table until the other transaction is completed. After the first transaction commits or rolls back, the second continues, and a deadlock doesn't occur. Using stored procedures for all data modifications can standardize the order of accessing objects.
Avoid user interaction in transactions
Avoid transactions that include user interaction, because the speed of batches running without user intervention is much faster than the speed at which a user must manually respond to queries, such as replying to a prompt for a parameter requested by an application. This degrades system throughput because any locks held by the transaction are released only when the transaction is committed or rolled back. Even if a deadlock doesn't occur, other transactions accessing the same resources are blocked while waiting for the transaction to complete.
Keep transactions short and in one batch
A deadlock typically occurs when several long-running transactions execute concurrently in the same database. The longer the transaction, the longer the exclusive or update locks are held, blocking other activity and leading to possible deadlock situations.
Keeping transactions in one batch minimizes network roundtrips during a transaction, reducing possible delays in completing the transaction due to client processing.
Avoid higher isolation levels
Determine whether a transaction can run at a lower isolation level. Using READ COMMITTED allows a transaction to read data previously read (but not modified) by another transaction without waiting for the transaction to complete. READ COMMITTED holds shared locks for a shorter duration than a higher isolation level, such as SERIALIZABLE. This reduces lock contention.
Use a row versioning-based isolation level
When the READ_COMMITTED_SNAPSHOT database option is set ON, a transaction running under the READ COMMITTED isolation level uses row versioning rather than shared locks during read operations.
Tip
Microsoft recommends the row versioning-based READ COMMITTED isolation level for all applications, unless an application relies upon the blocking behavior of the lock-based READ COMMITTED isolation level.
Snapshot isolation also uses row versioning, which doesn't use shared locks during read operations. Before a transaction can run under snapshot isolation, the ALLOW_SNAPSHOT_ISOLATION database option must be set ON.
Use row versioning-based isolation levels to minimize deadlocks that can occur between read and write operations.
Use bound connections
Using bound connections, two or more connections opened by the same application can cooperate with each other. Any locks acquired by the secondary connections are held as if they were acquired by the primary connection, and vice versa. Therefore, they don't block each other.
Cause a deadlock
You might need to cause a deadlock for learning or demonstration purposes.
The following example works in the AdventureWorksLT2019 sample database with the default schema and data when READ_COMMITTED_SNAPSHOT has been enabled. To download this sample, visit AdventureWorks sample databases.
For an example that causes a deadlock when optimized locking is enabled, see Optimized locking and deadlocks.
To cause a deadlock, you need to connect two sessions to the AdventureWorksLT2019 database. We refer to these sessions as Session A and Session B. You can create these two sessions by creating two query windows in SQL Server Management Studio (SSMS).
In Session A, run the following batch. This code begins an explicit transaction and executes a statement that updates the SalesLT.Product table. To do this, the transaction acquires an update (U) lock on the qualifying rows in table SalesLT.Product which are then converted to exclusive (X) locks. We leave the transaction open.
BEGIN TRANSACTION;

UPDATE SalesLT.Product
    SET SellEndDate = SellEndDate + 1
WHERE Color = 'Red';
Now, in Session B, run the following batch. This code doesn't explicitly begin a transaction. Instead, it operates in autocommit transaction mode. This statement updates the SalesLT.ProductDescription table. The update takes an update (U) lock on the qualifying rows in the SalesLT.ProductDescription table. The query joins to other tables, including the SalesLT.Product table.
UPDATE SalesLT.ProductDescription
    SET Description = Description
FROM SalesLT.ProductDescription AS pd
     INNER JOIN SalesLT.ProductModelProductDescription AS pmpd
         ON pd.ProductDescriptionID = pmpd.ProductDescriptionID
     INNER JOIN SalesLT.ProductModel AS pm
         ON pmpd.ProductModelID = pm.ProductModelID
     INNER JOIN SalesLT.Product AS p
         ON pm.ProductModelID = p.ProductModelID
WHERE p.Color = 'Silver';
To complete this update, Session B needs shared (S) locks on rows in table SalesLT.Product, including the rows that are locked by Session A. Session B is blocked on SalesLT.Product.
Return to Session A. Run the following UPDATE statement. This statement executes as a part of the previously open transaction.
UPDATE SalesLT.ProductDescription
    SET Description = Description
FROM SalesLT.ProductDescription AS pd
     INNER JOIN SalesLT.ProductModelProductDescription AS pmpd
         ON pd.ProductDescriptionID = pmpd.ProductDescriptionID
     INNER JOIN SalesLT.ProductModel AS pm
         ON pmpd.ProductModelID = pm.ProductModelID
     INNER JOIN SalesLT.Product AS p
         ON pm.ProductModelID = p.ProductModelID
WHERE p.Color = 'Red';
The second update statement in Session A is blocked by Session B on the SalesLT.ProductDescription.
Session A and Session B are now mutually blocking one another. Neither transaction can proceed, as they each need a resource that is locked by the other.
After a few seconds, the deadlock monitor identifies that the transactions in Session A and Session B are mutually blocking one another, and that neither can make progress. You see a deadlock occur, with Session A chosen as the deadlock victim. Session B completes successfully. An error message appears in the query window of Session A with text similar to the following example:
Msg 1205, Level 13, State 51, Line 7
Transaction (Process ID 51) was deadlocked on lock resources with another process and has been chosen as the deadlock victim. Rerun the transaction.
If a deadlock isn't raised, verify that READ_COMMITTED_SNAPSHOT is enabled in your sample database. Deadlocks can occur in any database configuration, but this example requires that READ_COMMITTED_SNAPSHOT is enabled.
You can view the details of the deadlock in the ring_buffer target of the system_health event session, which is enabled and active by default in SQL Server and Azure SQL Managed Instance. Consider the following query:
WITH cteDeadLocks ([Deadlock_XML])
AS (SELECT CAST (target_data AS XML) AS [Deadlock_XML]
    FROM sys.dm_xe_sessions AS xs
         INNER JOIN sys.dm_xe_session_targets AS xst
             ON xs.[address] = xst.event_session_address
    WHERE xs.[name] = 'system_health'
          AND xst.target_name = 'ring_buffer')
SELECT x.Graph.query('(event/data/value/deadlock)[1]') AS Deadlock_XML,
       x.Graph.value('(event/data/value/deadlock/process-list/process/@lastbatchstarted)[1]', 'datetime2(3)') AS when_occurred,
       DB_Name(x.Graph.value('(event/data/value/deadlock/process-list/process/@currentdb)[1]', 'int')) AS DB --Current database of the first listed process
FROM (SELECT Graph.query('.') AS Graph
      FROM cteDeadLocks AS c
      CROSS APPLY c.[Deadlock_XML].nodes('RingBufferTarget/event[@name="xml_deadlock_report"]') AS Deadlock_Report(Graph)) AS x
ORDER BY when_occurred DESC;
You can view the XML in the Deadlock_XML column inside SSMS, by selecting the cell that appears as a hyperlink. Save this output as a .xdl file, close, then reopen the .xdl file in SSMS for visual deadlock graph. The deadlock graph should look something like the following image.

Optimized locking and deadlocks
With optimized locking, page and row locks aren't held until the end of transaction. They are released as soon as a row is updated. Additionally, if READ_COMMITTED_SNAPSHOT is enabled, update (U) locks aren't used. As a result, the likelihood of deadlocks is reduced.
The previous example doesn't cause a deadlock when optimized locking is enabled because it relies on the update (U) locks.
The following example can be used to cause a deadlock on a database that has optimized locking enabled.
First, create an example table and add data.
CREATE TABLE t2
(
    a INT PRIMARY KEY NOT NULL,
    b INT NULL
);

INSERT INTO t2
VALUES (1, 10),
(2, 20),
(3, 30);
The following T-SQL batches, executed in sequence in two separate sessions, create a deadlock.
In session 1:
BEGIN TRANSACTION xactA;

UPDATE t2
    SET b = b + 10
WHERE a = 1;
In session 2:
BEGIN TRANSACTION xactB;

UPDATE t2
    SET b = b + 10
WHERE a = 2;
In session 1:
UPDATE t2
    SET b = b + 100
WHERE a = 2;
In session 2:
UPDATE t2
    SET b = b + 20
WHERE a = 1;
In this case, each session holds an exclusive (X) lock on its own transaction ID (TID) resource, and is waiting on the shared (S) lock on the other TID, resulting in a deadlock.
The following abbreviated deadlock report contains elements and attributes specific to optimized locking. Under each resource in the deadlock report <resource-list>, each <xactlock> element reports the underlying resources and TID lock information of each member of a deadlock.
<deadlock>
 <victim-list>
  <victimProcess id="process12994344c58" />
 </victim-list>
 <process-list>
  <process id="process12994344c58" taskpriority="0" logused="272" waitresource="XACT: 23:2476:0 KEY: 23:72057594049593344 (8194443284a0)" waittime="447" ownerId="3234906" transactionname="xactA" lasttranstarted="2025-10-08T21:36:34.063" XDES="0x12984ba0480" lockMode="S" schedulerid="2" kpid="204928" status="suspended" spid="95" sbid="0" ecid="0" priority="0" trancount="2" lastbatchstarted="2025-10-08T21:36:40.857" lastbatchcompleted="2025-10-08T21:36:34.063" lastattention="2025-10-08T21:36:11.340" clientapp="Microsoft SQL Server Management Studio - Query" hostname="WS1" hostpid="23380" loginname="user1" isolationlevel="read committed (2)" xactid="3234906" currentdb="23" currentdbname="AdventureWorksLT" lockTimeout="4294967295" clientoption1="671090784" clientoption2="390200">
   <inputbuf>
UPDATE t2
    SET b = b + 20
WHERE a = 1;
   </inputbuf>
  </process>
  <process id="process1299c969828" taskpriority="0" logused="272" waitresource="XACT: 23:2477:0 KEY: 23:72057594049593344 (61a06abd401c)" waittime="3083" ownerId="3234886" transactionname="xactB" lasttranstarted="2025-10-08T21:36:30.303" XDES="0x12995c84480" lockMode="S" schedulerid="2" kpid="63348" status="suspended" spid="88" sbid="0" ecid="0" priority="0" trancount="2" lastbatchstarted="2025-10-08T21:36:38.223" lastbatchcompleted="2025-10-08T21:36:30.303" lastattention="1900-01-01T00:00:00.303" clientapp="Microsoft SQL Server Management Studio - Query" hostname="WS1" hostpid="23380" loginname="user1" isolationlevel="read committed (2)" xactid="3234886" currentdb="23" currentdbname="AdventureWorksLT" lockTimeout="4294967295" clientoption1="671090784" clientoption2="390200">
   <inputbuf>
UPDATE t2
    SET b = b + 100
WHERE a = 2;
   </inputbuf>
  </process>
 </process-list>
 <resource-list>
  <xactlock xdesIdLow="2476" xdesIdHigh="0" dbid="23" id="lock1299fa06c00" mode="X">
   <UnderlyingResource>
    <keylock hobtid="72057594049593344" dbid="23" objectname="e6fc405e-1ee8-49df-a2b3-54ee0151d851.dbo.t2" indexname="PK__t2__3BD0198ED3CBA65E" />
   </UnderlyingResource>
   <owner-list>
    <owner id="process1299c969828" mode="X" />
   </owner-list>
   <waiter-list>
    <waiter id="process12994344c58" mode="S" requestType="wait" />
   </waiter-list>
  </xactlock>
  <xactlock xdesIdLow="2477" xdesIdHigh="0" dbid="23" id="lock129940b2380" mode="X">
   <UnderlyingResource>
    <keylock hobtid="72057594049593344" dbid="23" objectname="e6fc405e-1ee8-49df-a2b3-54ee0151d851.dbo.t2" indexname="PK__t2__3BD0198ED3CBA65E" />
   </UnderlyingResource>
   <owner-list>
    <owner id="process12994344c58" mode="X" />
   </owner-list>
   <waiter-list>
    <waiter id="process1299c969828" mode="S" requestType="wait" />
   </waiter-list>
  </xactlock>
 </resource-list>
</deadlock>
Related content
- Extended Events overview
- sys.dm_tran_locks (Transact-SQL)
- Deadlock Graph Event Class
- Deadlocks with Read Repeatable Isolation Level
- Lock:Deadlock Chain Event Class
- Lock:Deadlock Event Class
- SET DEADLOCK_PRIORITY (Transact-SQL)
- Analyze and prevent deadlocks in Azure SQL Database and SQL database in Fabric
- Open, view, and print a deadlock file in SQL Server Management Studio (SSMS)