Lesson 6: Add grouping and totals (Reporting Services)
In the final tutorial lesson, you're going to add grouping and totals to your Reporting Services report to organize and summarize your data.
Group data in a report
Select the Design tab.
If you don't see the Row Groups pane, right-click the design surface and select View >Grouping.
From the Report Data pane, drag the
[Date]field to the Row Groups pane. Place it above the row displayed as = (Details).Note
The row handle now has a bracket in it, to indicate a group. The table now also has two
[Date]expression columns, one on both sides of a vertical dotted line.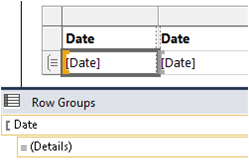
From the Report Data pane, drag the
[Order]field to the Row Groups pane. Place it after Date and before = (Details).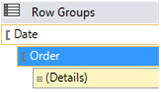
Note
Now the row handle has two brackets in it,
 to indicate two groups. The table now also has two
 [Order]expression columns.Delete the original
[Date]and[Order]expression columns to the right of the double line. Select the column handles for the two columns, right-click and choose Delete Columns. Report Designer removes the individual row expressions, so that only the group expressions are displayed.
To format the new
[Date]column, right-click the data region cell that contains the[Date]expression, and select Text Box Properties.Select Number in the left-most column list box, and Date from the Category list box.
In the Type list box, select January 31, 2000.
Select OK to apply the format.
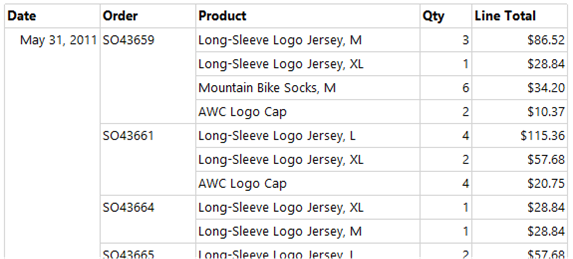
Again, preview the report. It should look like the following image:
Add totals to a report
Switch to the Design view.
Right-click the data region cell that contains the
[LineTotal]expression, and select Add Total. Report Designer adds a row with a sum of the dollar amount for each order.Right-click the cell that contains the field
[Qty], and select Add Total. Report Designer adds a sum of the quantity for each order to the totals row.In the empty cell to the left of the
Sum[Qty]cell, enter the string "Order Total".You can add a background color to the totals row. Select the two sum cells and the label cell.
From the Format menu, select Background Color > Light Gray square.
Select OK to apply the format.
Add the daily total to the report
Right-click the
[Order]expression cell, and select Add Total > After. Report Designer adds a new row containing sums of the[Qty]and[Linetotal]values for each day, and the string "Total" to the bottom of the[Order]expression column.Enter the word "Daily" before the word "Total" in the same cell, so it reads "Daily Total".
Select that cell and the two adjacent total cells to the right side and the empty cell in between them.
From the Format menu, select Background Color > Orange square.
Select OK to apply the format.
Add the grand total to the report
Right-click the
[Date]expression cell, and select Add Total > After. Report Designer adds a new row containing sums of the[Qty]and[LineTotal]values for the entire report, and the string "Total" to the bottom of the[Date]expression column.Enter the string "Grand" before the word "Total" in the same cell, so it reads "Grand Total".
Select the cell with "Grand Total", the two
Sum()expression cells and the empty cells between them.From the Format menu, select Background Color > Light Blue square.
Select OK to apply the format.
Preview the report
To preview the format changes, select the Preview tab. In the Preview toolbar, choose the Last Page button, which looks like  The results should display as shown in the following image:
Publish the report to the Report Server (Optional)
An optional step is to publish the completed report to the Report Server so you can view the report in the web portal.
Select Project menu > Tutorial Properties...
In the TargetServerURL, enter the name of your report server, for example:
http:/<servername>/reportserverorhttps://localhost/reportserverworks if you're designing the report on the report server.
The TargetReportFolder is named Tutorial from the name of the project. Report Designer deploys the report to this folder.
Select OK.
Select Build menu > Deploy Tutorial.
If you see something like the message in the following Output window, it indicates a successful deployment.
------ Build started: Project: tutorial, Configuration: Debug ------
Skipping 'Sales Orders.rdl'. Item is up to date.
Build complete -- 0 errors, 0 warnings
------ Deploy started: Project: tutorial, Configuration: Debug ------
Deploying tohttps://[server name]/reportserver
Deploying report '/tutorial/Sales Orders'.
Deploy complete -- 0 errors, 0 warnings
========== Build: 1 succeeded or up-to-date, 0 failed, 0 skipped ==========
========== Deploy: 1 succeeded, 0 failed, 0 skipped ==========If you see something similar to the following error message, verify you have the appropriate permissions on the report server and you started SQL Server Data Tools with administrator privileges.
"The permissions granted to user 'XXXXXXXX\[your user name]' are insufficient for performing this operation"
Open a browser with administrator privileges. For example, right-click the icon for Internet Explorer and select Run as administrator.
Browse to the web portal URL.
https://<server name>/reports.https://localhost/reportsworks if you're designing the report on the report server.
Select the Tutorial folder, and then choose the "Sales Orders" report to view the report.
You successfully completed the Creating a Basic Table Report tutorial.
Related content
Feedback
Coming soon: Throughout 2024 we will be phasing out GitHub Issues as the feedback mechanism for content and replacing it with a new feedback system. For more information see: https://aka.ms/ContentUserFeedback.
Submit and view feedback for