Note
Access to this page requires authorization. You can try signing in or changing directories.
Access to this page requires authorization. You can try changing directories.
Note
SQL Server Mobile Report Publisher is deprecated for all releases of SQL Server Reporting Services after SQL Server Reporting Services 2019. It's discontinued starting in SQL Server Reporting Services 2022 and Power BI Report Server.
Learn how to create a Reporting Services mobile report that looks and acts like a tabbed report by using drillthrough and parameters.
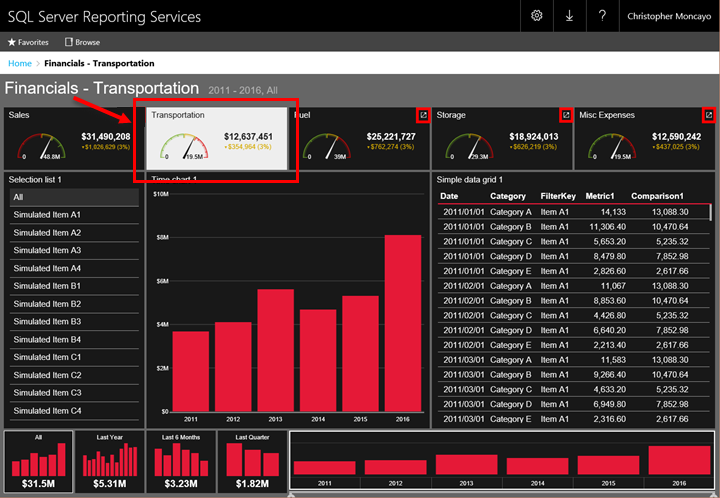
For example, in this report, the gauges across the top act like tabs. When you select the Transportation gauge, the data in the rest of the chart is filtered to the transportation data.

Behind the scenes, this report is really a set of five separate reports, each with a different parameter that filters the report to match the gauge selected at the top of the report. You create all five reports first, then for each of the five reports, you make the other four gauges into drillthroughs to the other four reports.
Here are the steps for this example.
Create the basic report
Create a report called Sales, with five gauges:
- Sales
- Transportation
- Fuel
- Storage
- Misc Expenses
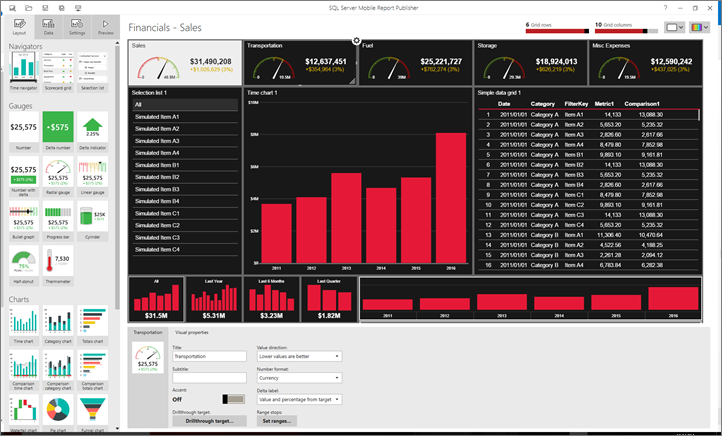
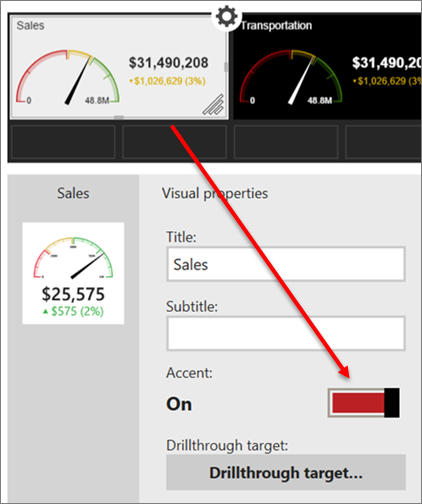
Set Accent to On for the Sales gauge, so it contrasts with the rest of the report--in this case, white on black.
Save it to a Reporting Services report server.
Make copies of the report
Make four copies of the Sales report and name them:
- Transportation
- Fuel
- Storage
- Misc Expenses
Save them to the Reporting Services report server.
Set the gauge as a drillthrough
In this section, you set each gauge, other than the Sales gauge, as a drillthrough to its respective report.
In the Sales report, select the Transportation gauge.
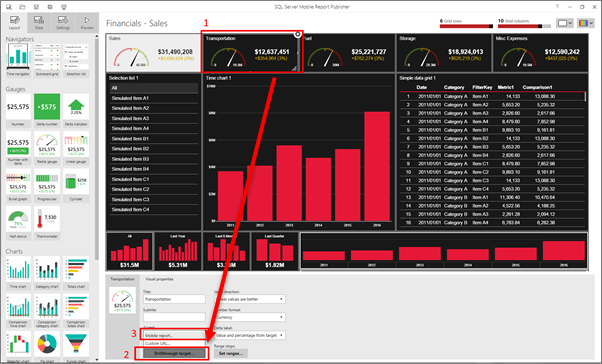
With the Layout tab selected, in the Visual properties pane, select Drillthrough target.
Select Mobile report.
Navigate to and select the report that is the destination for the drillthrough--in this case, "Financials - Transportation."
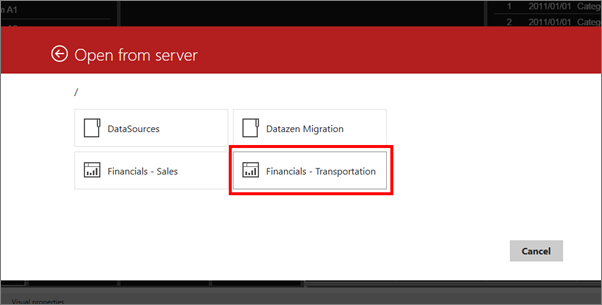
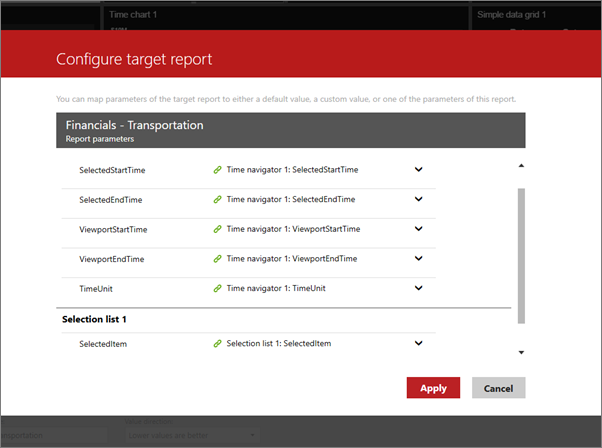
In Configure target report, select the parameter to filter the report, and select Apply.
Repeat these steps for each of the other gauges in the Sales report.
Set the gauges for the other reports
Open the Transportation report, set the Sales gauge as a drillthrough to the Sales report, and the other three gauges as drillthroughs to their respective reports.
Still in the Transportation report, set Accent for the Transportation gauge to On, contrast with the rest of the report.
Repeat these steps for the Fuel, Storage, and Misc Expenses reports.
View the report in the web portal
Go to the Reporting Services report server and open one of the reports.
Notice that each of the gauges has a drillthrough icon in the upper-right corner.
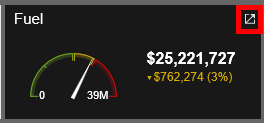
Select one of the gauges to go to the report filtered to that gauge's data.